You're planning an immersive experience for your museum, retail flagship, hotel lobby, or event—but which technology should you choose?
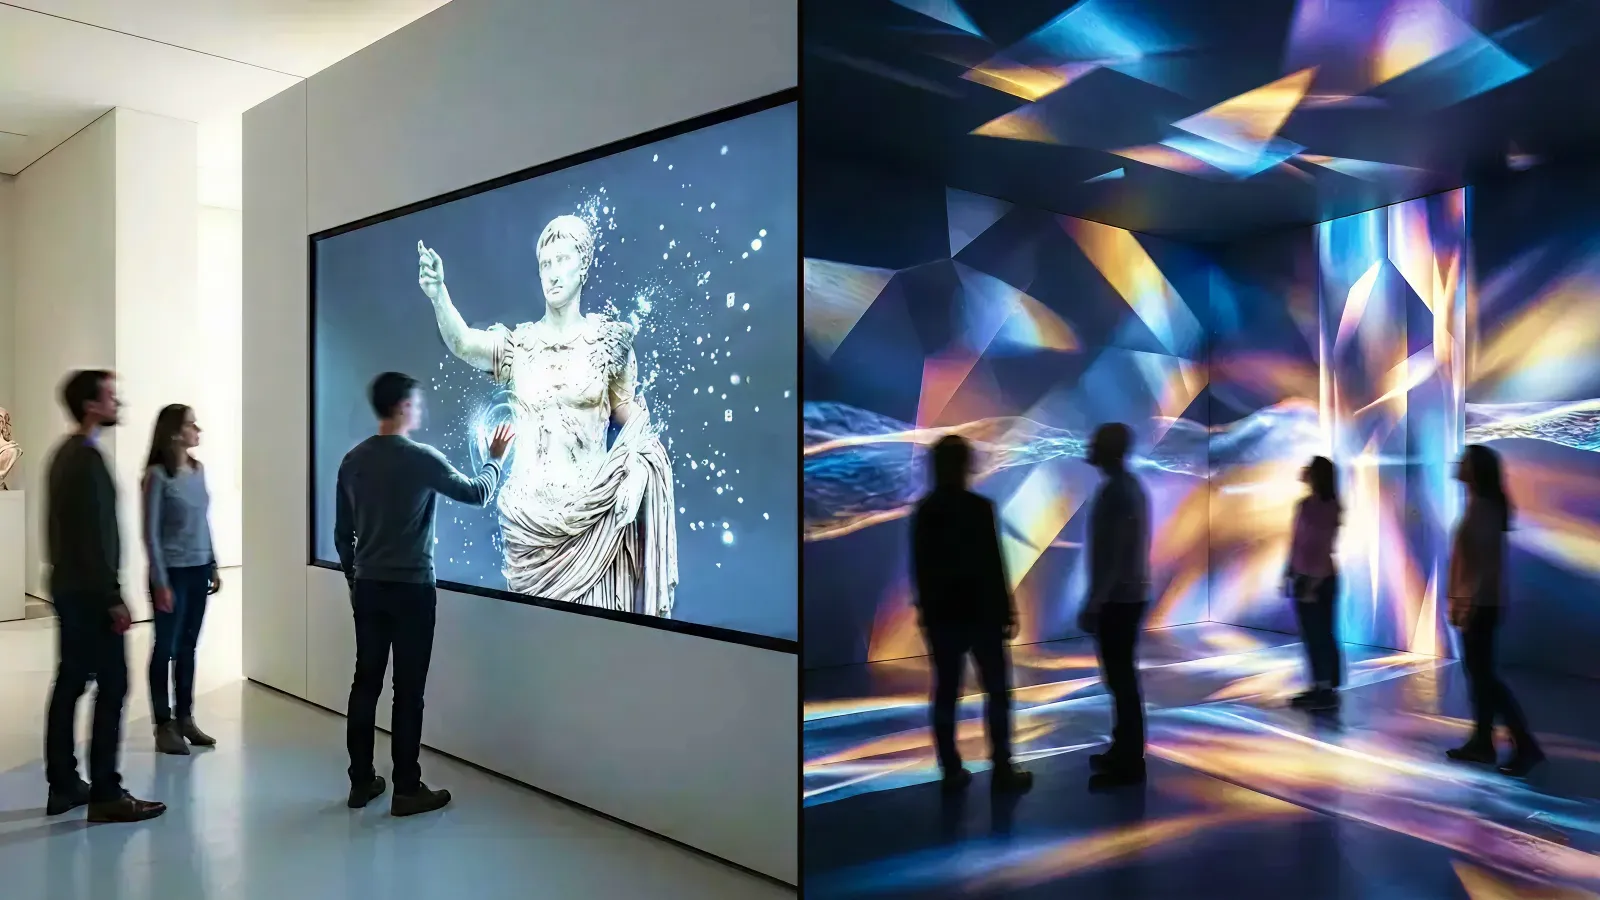
Interactive installations and projection mapping are both powerful tools for creating memorable moments. But they serve different purposes, fit different budgets, and work best in different contexts. Choosing the wrong one can mean overspending on permanence you don't need—or underinvesting in durability for a space that deserves a lasting experience.
This guide helps you understand the real differences, compare costs and timelines, and decide which approach fits your venue, audience, and goals.
Who this is for: Museum directors, retail brand managers, hotel GMs, event planners, and experience designers evaluating immersive technology options.
Key Takeaways
- Interactive installations are permanent, touchable, and measurable—ideal for venues that need reliable daily engagement over 5-10 years.
- Projection mapping offers spectacular visual impact and flexibility—best for temporary events, unusual surfaces, or when you want to "disappear" the technology.
- Budget ranges differ significantly: installations typically $40K-$200K+ for permanent builds; projection mapping $10K-$50K per event or $30K-$100K+ for permanent setups.
- The choice often isn't "either/or"—many successful venues combine both for different zones or moments.
- Always start with the experience goal, not the technology.
1. Quick Comparison: Interactive Installation vs Projection Mapping
| Factor | Interactive Installation | Projection Mapping |
|---|---|---|
| User interaction | Touch, gesture, presence, choices | Primarily visual (some sensor-based) |
| Best for | Daily engagement, education, data capture | Spectacle, atmosphere, temporary wow |
| Lifespan | 5-10 years | Event-based or 3-5 years (lamp life) |
| Maintenance | Low (solid-state displays) | Medium-High (lamp replacement, alignment) |
| Content updates | Easy via CMS | Requires re-mapping for new surfaces |
| Setup time | 2-8 weeks (install + calibration) | 1-7 days (depending on complexity) |
| Best surfaces | Flat screens, tables, walls | Any surface: buildings, objects, rooms |
| Analytics | Rich (dwell time, completions, paths) | Limited (view counts, crowd density) |
| Cost range | $40K-$200K+ (permanent) | $10K-$50K/event or $30K-$100K+ (permanent) |
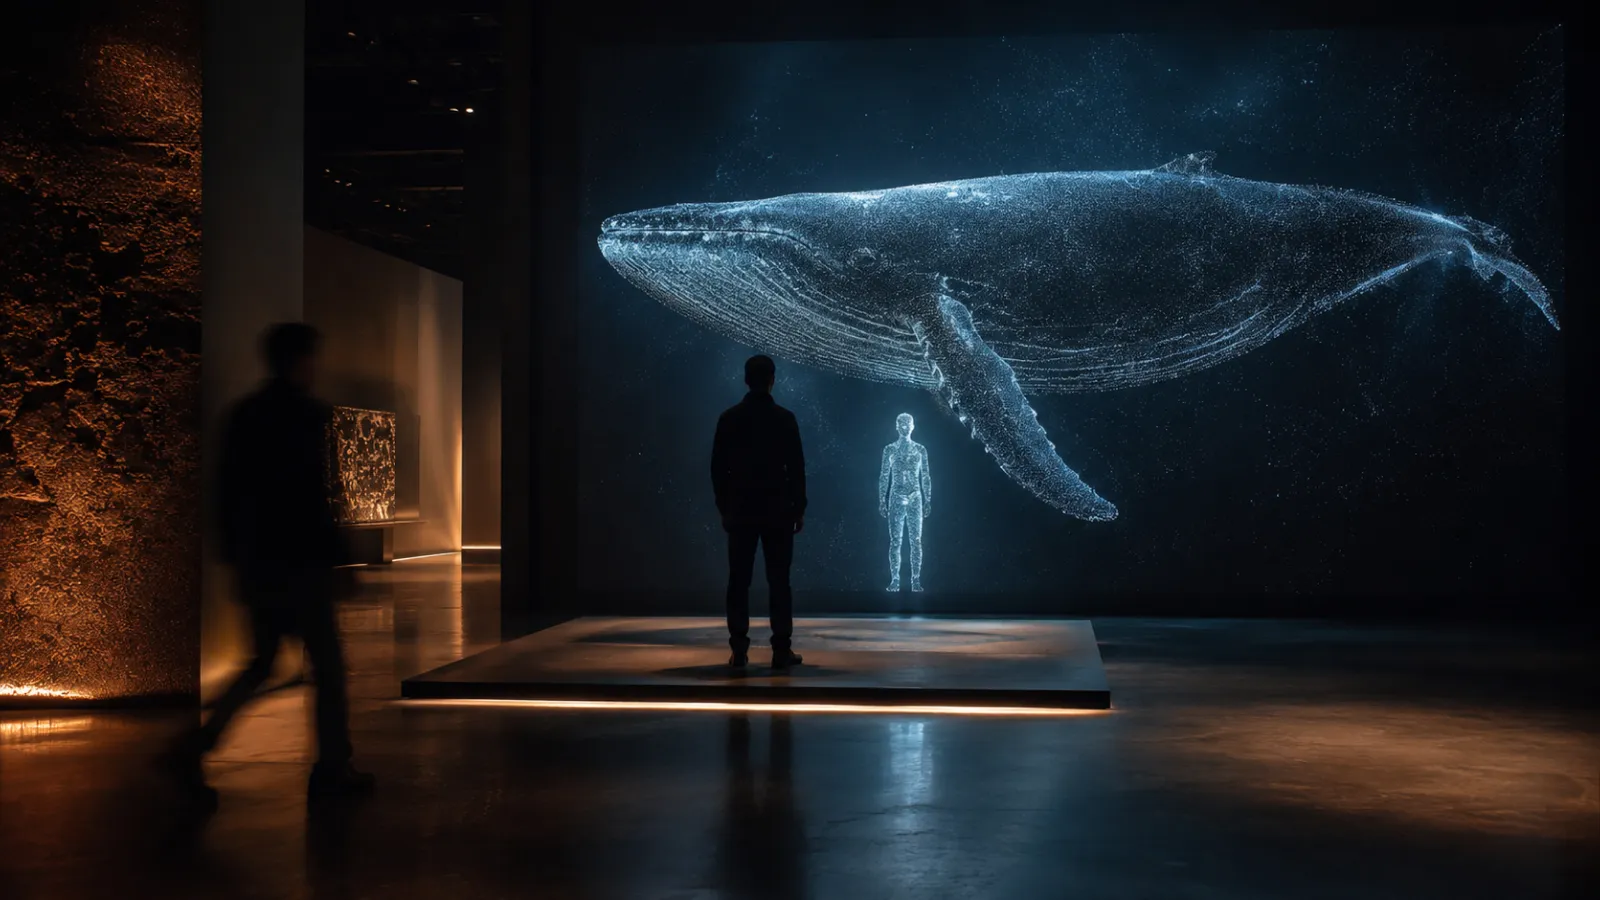
2. What Is an Interactive Installation?
An interactive installation is a digital experience that responds to visitor input—touch, movement, presence, or choices—to create a personalized moment.
2-1. Common Formats
- Touch screens and tables: Multi-touch displays for exploring content, browsing collections, or playing experiences
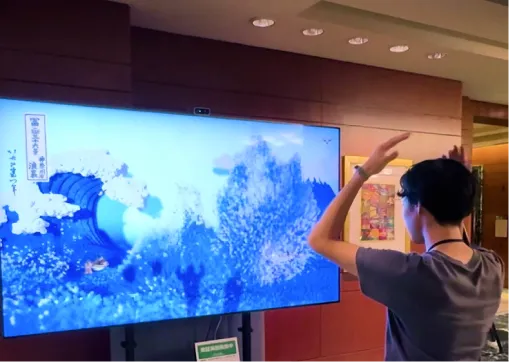
- Gesture-based walls: Full-body motion tracking creates visual responses without touching anything
- Sensor-triggered experiences: Visitors walking into a zone activates content
- Object-based interaction: RFID, NFC, or camera-tracked physical objects trigger digital responses
- Kiosk and wayfinding systems: Self-service information with interactive exploration
2-2. Key Characteristics
- Permanence: Designed for daily operation over 5-10 years
- Measurability: Can track dwell time, completion rates, choices made, repeat visits
- Reliability: Commercial-grade hardware runs 12-24 hours daily
- Personalization: Each visitor's experience can be unique based on their inputs
Interactive installations excel when you need consistent, measurable engagement that builds over time.
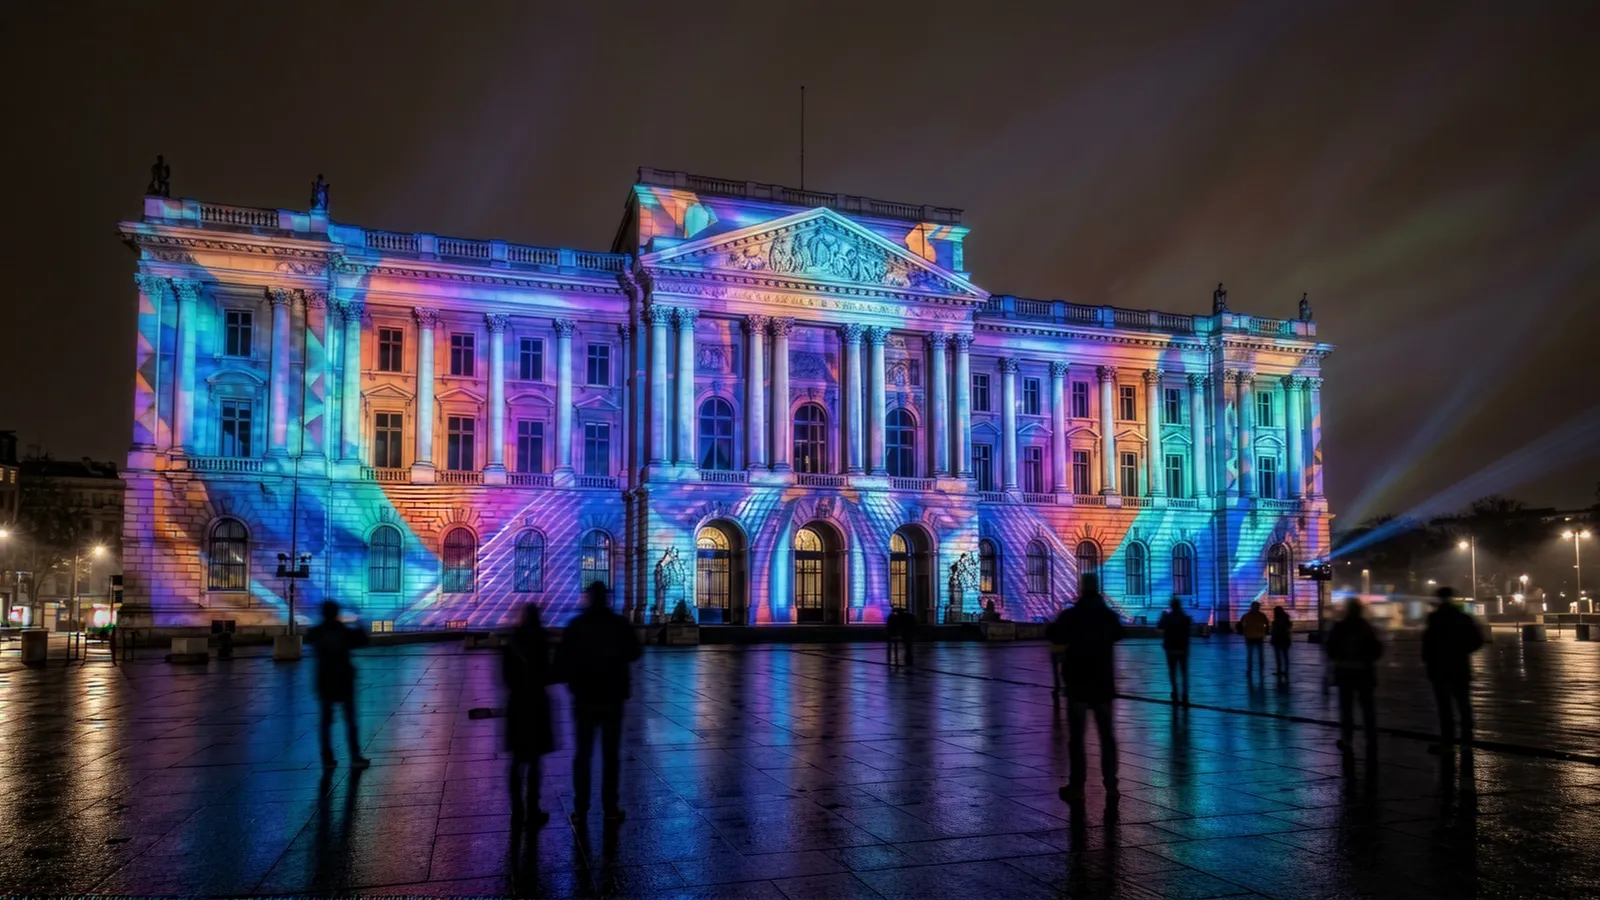
3. What Is Projection Mapping?
Projection mapping uses projectors to cast video content onto surfaces—buildings, objects, rooms, or architectural features—transforming them into dynamic visual displays.
3-1. Common Formats
- Building facades: Large-scale outdoor projection for events, brand moments, or public art
- Object mapping: Projecting onto 3D objects (cars, sculptures, products) to create animated surfaces
- Immersive rooms: Floor-to-ceiling projection creates environment-scale experiences
- Architectural highlighting: Accentuating interior features (ceilings, columns, alcoves)
- Stage and event mapping: Dynamic backdrops that respond to performance
3-2. Key Characteristics
- Surface flexibility: Works on any surface—flat, curved, irregular, textured
- Invisible technology: When done well, the projector disappears and only the content is seen
- Atmospheric impact: Creates mood, wonder, and spectacle at scale
- Content-dependent: The experience is primarily visual; interaction is secondary
Projection mapping excels when you want visual spectacle on unusual surfaces or temporary transformation without permanent hardware.
4. Cost and Timeline Comparison
Understanding the true cost requires looking beyond the initial build.
4-1. Interactive Installation Costs
| Tier | Scope | Budget Range | Timeline |
|---|---|---|---|
| Entry | Single large touch screen with simple interaction | $40K-$80K | 8-12 weeks |
| Mid-range | Multi-station setup or gesture wall with CMS | $80K-$150K | 12-16 weeks |
| Premium | Room-scale or multi-room integrated experience | $150K-$300K+ | 16-24 weeks |
Ongoing costs: Minimal—software updates, occasional hardware maintenance, content refresh every 2-3 years.
4-2. Projection Mapping Costs
| Tier | Scope | Budget Range | Timeline |
|---|---|---|---|
| Event rental | Single-night building facade or event | $10K-$50K | 1-7 days setup |
| Short-term | Pop-up or seasonal installation (1-3 months) | $30K-$80K | 1-3 weeks |
| Permanent | Always-on immersive room or architectural feature | $50K-$150K+ | 4-12 weeks |
Ongoing costs: Lamp replacement ($500-$2,000 per projector, every 2,000-5,000 hours), alignment recalibration, content updates require re-mapping.
4-3. Total Cost of Ownership (5-Year View)
| Technology | Initial Build | Annual Maintenance | 5-Year Total |
|---|---|---|---|
| Interactive installation ($100K build) | $100K | ~$5K | ~$125K |
| Projection mapping ($80K build) | $80K | ~$15K | ~$155K |
For permanent venues, interactive installations often have lower total cost despite higher upfront investment—because solid-state displays don't require lamp replacement and need less ongoing calibration.
5. Decision Scenarios by Venue Type
5-1. Museums and Cultural Venues
Choose interactive installation when:
- You need visitors to explore content at their own pace
- Educational outcomes matter (learning time, information retention)
- Analytics will inform exhibit improvement
- The experience runs 6+ hours daily, 7 days a week
Choose projection mapping when:
- You want to transform a historical space without touching surfaces
- The goal is atmosphere and emotional impact, not information transfer
- You're creating a temporary exhibition or seasonal feature
- Visitor flow should be "walk-through" rather than "stop and explore"
Hybrid example: A natural history museum uses interactive tables for specimen exploration (touchable, measurable) while projection mapping on the ceiling creates an immersive sky environment (atmospheric, spectacular).
5-2. Retail Flagships and Brand Experiences
Choose interactive installation when:
- You want to capture customer data (sign-ups, preferences)
- The experience should drive dwell time near products
- UGC and social sharing are key goals
- Staff need a CMS to update campaigns
Choose projection mapping when:
- Window displays need to transform for seasonal campaigns
- You want to create a "discovery moment" as customers enter
- The brand story is primarily visual and emotional
- Budget allows rental-based flexibility
Hybrid example: A luxury fashion flagship uses interactive mirrors (try-on, personalization, data capture) combined with projection-mapped window displays (street-stopping spectacle, easy seasonal refresh).
5-3. Hotels and Hospitality
Choose interactive installation when:
- Lobby engagement should run 24/7 without supervision
- Guest personalization is important (language, preferences)
- You need reliability across thousands of guest interactions
- The experience should feel "premium" and tactile
Choose projection mapping when:
- Architectural features deserve dramatic highlighting
- You want a "wow moment" at arrival without visible screens
- Event spaces need flexible, transformable atmosphere
- Budget prioritizes visual impact over interaction
Hybrid example: A boutique hotel uses an interactive concierge screen (wayfinding, local recommendations) alongside projection-mapped lobby art that shifts from morning to evening ambiance.
5-4. Events and Temporary Activations
Choose interactive installation when:
- The event runs multiple days and needs reliable performance
- Data capture (leads, sign-ups) is a primary goal
- You'll reuse the hardware at future events
- Visitors should spend 2+ minutes engaging
Choose projection mapping when:
- Visual spectacle is the primary goal
- The event is one night or a short run
- You need to transform a venue without permanent changes
- The "shareable moment" matters more than data capture
Hybrid example: A product launch uses projection mapping for the reveal moment (spectacular, shareable) plus interactive stations for product exploration (data capture, dwell time).
6. Technical Requirements Comparison
6-1. Space and Environment
| Factor | Interactive Installation | Projection Mapping |
|---|---|---|
| Lighting control | Moderate (works in ambient light) | Critical (darker is better) |
| Surface requirements | Flat, level mounting surfaces | Any surface, but neutral colors project best |
| Power | Standard outlets (most displays) | Higher power draw (projectors run hot) |
| Ventilation | Standard HVAC | Extra cooling often needed |
| Noise | Silent | Projector fans can be audible |
| Ceiling height | Flexible | Needs throw distance for projectors |
6-2. Maintenance Burden
Interactive installations:
- Screen cleaning (weekly)
- Software updates (quarterly)
- Hardware inspection (annually)
- Content refresh (as needed, via CMS)
Projection mapping:
- Lamp replacement (every 2,000-5,000 hours)
- Alignment recalibration (after any movement or lamp change)
- Dust/filter cleaning (monthly)
- Content updates require re-mapping if surfaces change
6-3. Content Update Flexibility
Interactive installations: Content updates via CMS can happen remotely, even daily. New campaigns don't require on-site work unless hardware changes.
Projection mapping: Content updates are easy if the surface hasn't changed. But new surfaces or significant layout changes require re-mapping (on-site calibration).
7. Analytics and Measuring ROI
7-1. Interactive Installation Metrics
| Metric | What It Measures | Why It Matters |
|---|---|---|
| Stop rate | % of passersby who engage | Measures initial attraction |
| Dwell time | Time spent interacting | Indicates engagement depth |
| Completion rate | % who reach the "end" | Measures content effectiveness |
| Path analysis | Which content is explored | Informs content optimization |
| Return rate | Repeat visitors (if trackable) | Measures lasting interest |
| Conversion | Sign-ups, downloads, QR scans | Ties to business outcomes |
Interactive installations can capture granular, actionable data that improves over time.
7-2. Projection Mapping Metrics
| Metric | What It Measures | Why It Matters |
|---|---|---|
| Crowd density | People in viewing area | Measures reach |
| Social mentions | Posts, shares, hashtags | Measures virality |
| Event attendance | Total viewers for a show | Basic reach metric |
| Press coverage | Media mentions | PR value |
Projection mapping metrics are typically aggregate and impression-based—harder to tie to individual behavior or conversion.
7-3. ROI Framework
For interactive installations: Calculate based on engagement volume × conversion rate × customer lifetime value, plus efficiency gains from content refresh via CMS.
For projection mapping: Calculate based on impressions × brand awareness lift, plus PR value of media coverage and social sharing.
8. Hybrid Approaches: Using Both Together
Many of the best immersive experiences combine both technologies strategically.
8-1. When Hybrid Makes Sense
- Large venues with multiple zones serving different purposes
- Customer journeys that move from "discover" (projection) to "explore" (interaction)
- Mixed content goals: Some content is atmospheric, some is informational
- Budget allows both entry-level versions of each technology
8-2. Hybrid Design Principles
- Separate zones: Don't compete technologies in the same sightline
- Sequential experience: Projection for arrival/atmosphere, interaction for depth
- Consistent narrative: Both technologies tell the same brand story
- Clear wayfinding: Guide visitors from spectacle to engagement
8-3. Hybrid Example: Museum Gallery
- Entry: Projection mapping on the walls creates an immersive environment (mood, context-setting)
- Center: Interactive tables let visitors explore artifacts and stories at their own pace
- Exit: A photo opportunity with projection-mapped backdrop (UGC moment)
9. Common Pitfalls to Avoid
9-1. Don't Rent Projection for Permanent Spaces
If you need content running 8+ hours daily, year-round, the ongoing costs of projection (lamps, recalibration) often exceed the cost of an interactive display that runs maintenance-free for years.
9-2. Don't Build Permanent Without Testing
Before committing $100K+ to a permanent installation, prototype or pilot the concept. Run a pop-up version. Gather visitor feedback. Iterate before you pour concrete.
9-3. Don't Underestimate Lighting Requirements
Projection mapping in a sunlit atrium will fail. If you can't control ambient light, interactive displays (which generate their own light) are usually more reliable.
9-4. Don't Ignore Content Refresh
The fanciest hardware becomes "background noise" if content never changes. Budget for ongoing content updates—especially for interactive experiences where visitors might return.
9-5. Don't Assume "Bigger = Better"
A single well-designed interactive moment often outperforms a sprawling but unfocused experience. Define the one thing you want visitors to feel or do, then design everything around that.
10. About Utsubo
Utsubo is a creative studio specializing in interactive installations and immersive web experiences.
We've built experiences for museums, retail brands, hotels, and events—and we're technology-agnostic. We help clients choose the right approach (installation, projection, web, or hybrid) based on their goals, not based on what we want to sell.
Whether you're weighing a flagship interactive installation or considering projection mapping for an event, we can help you plan, prototype, and build the right experience.
11. Book a Free 30-Minute Planning Call
If you're comparing interactive installation vs projection mapping for an upcoming project, book a free 30-minute call. We'll help you:
- Clarify which technology fits your venue and goals
- Understand realistic budgets and timelines
- Identify pilot opportunities to test before committing
12. Decision-Maker Checklist
- We've defined the primary experience goal (education, atmosphere, data capture, spectacle)
- We understand our lighting conditions and whether projection is viable
- We've estimated daily operating hours and calculated maintenance implications
- We've considered content update frequency and how updates will happen
- We've identified which metrics matter most for measuring success
- We've explored hybrid possibilities (different technologies for different zones)
- We've budgeted for ongoing costs, not just initial build
- We've considered a pilot or prototype before committing to permanent installation
- We've talked to a partner who can advise on both technologies, not just one
FAQs
Which technology has better ROI: interactive installation or projection mapping? It depends on your goals. Interactive installations typically offer better ROI for venues prioritizing daily engagement, data capture, and long-term operation—because they're measurable and have lower ongoing costs. Projection mapping often delivers better ROI for events, brand launches, and PR moments where impressions and social sharing matter more than individual engagement metrics.
Can projection mapping be interactive? Yes, but with limitations. You can add sensors (motion tracking, cameras) to trigger projection changes based on visitor presence or movement. However, the interaction is typically less precise than touch-based systems, and the analytics are less granular. For "wow factor" interactive projection, budget more for the sensing infrastructure.
How long does each technology last? Interactive installations with commercial-grade displays typically last 5-10 years with minimal maintenance. Projection mapping hardware lasts similarly, but projector lamps need replacement every 2,000-5,000 hours of operation, adding ongoing cost and downtime for permanent installations.
What if I need both spectacle AND data capture? This is a common scenario—and a good case for a hybrid approach. Use projection mapping for the "arrival moment" and atmosphere, then transition visitors to interactive stations for deeper engagement and data capture. Design them as a sequence, not competitors.
Should I start with a pilot or go straight to permanent installation? We almost always recommend piloting first, especially for interactive installations. Run a 2-4 week test, gather visitor feedback, analyze engagement data, and iterate before committing to the permanent build. The insights from a pilot often change the final design significantly—and always for the better.
 Osaka Interactive Installation Studio