A guide to interactive technology in public and research libraries — what works, what it costs, how to fund it, and how to keep the collection as the star.
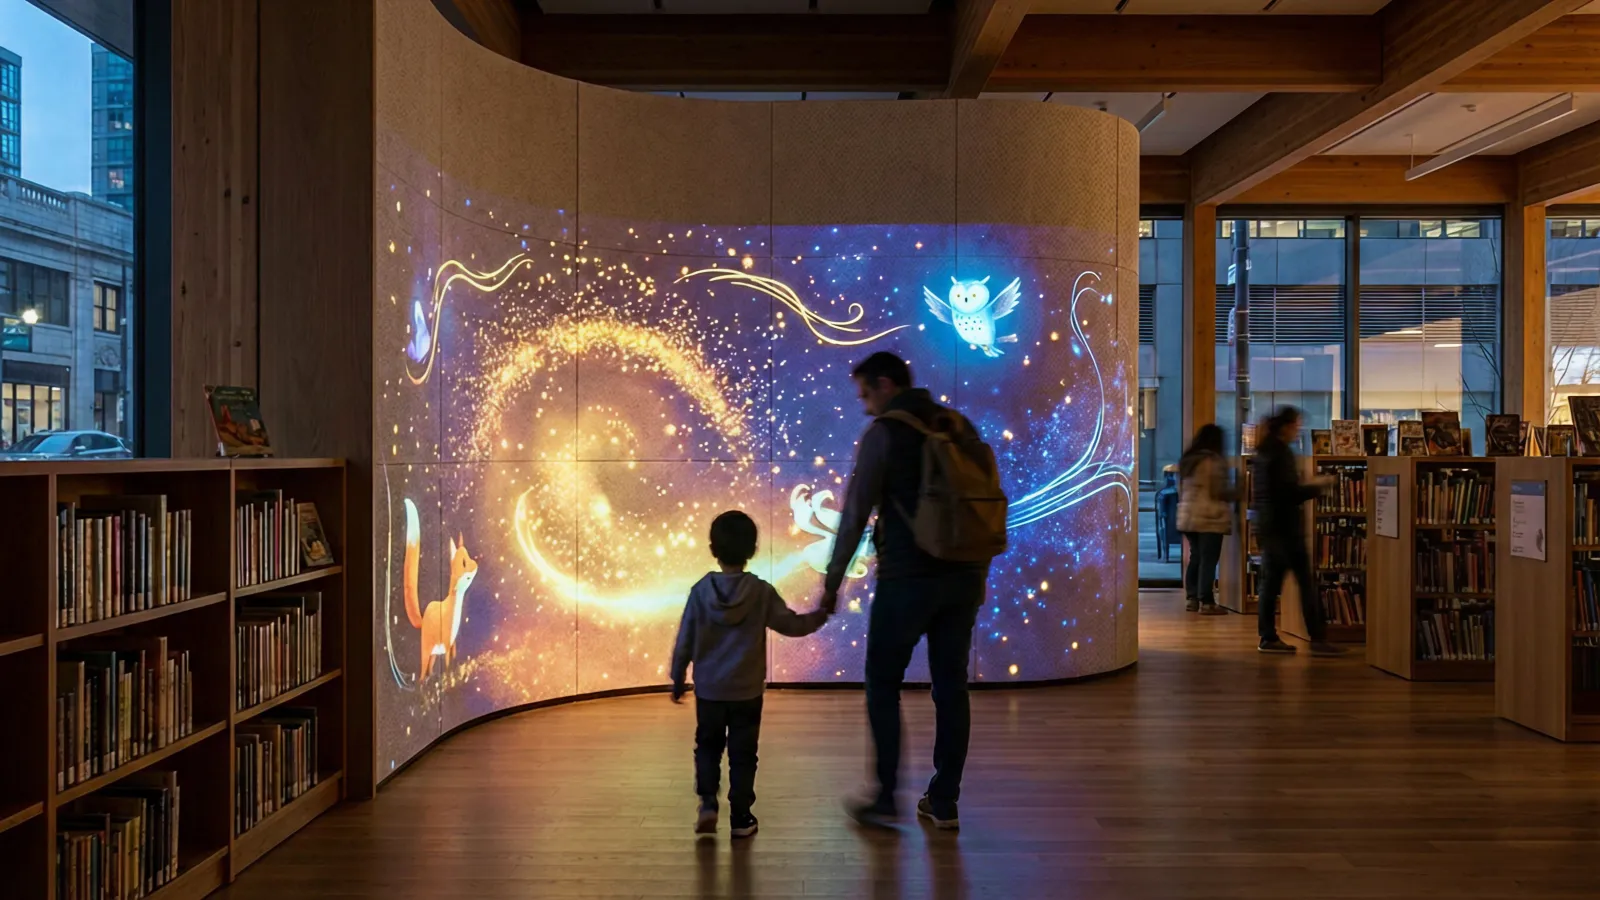
A child steps into a curved projection room at Singapore's Central Public Library. She selects The Wizard of Oz, twists the genre to horror, moves the setting to a jungle, and watches the story regenerate around her — projected across the walls, narrated by AI, downloaded as a PDF she takes home. No app. No headset. No adult supervision required.
This is StoryGen, one of Singapore's National Library Board prototypes under their LAB25 blueprint — and one of a growing number of interactive installations proving that libraries can be technology-forward without betraying their mission.
But that mission makes library installations fundamentally different from every other venue.
Museums want spectacle. Retail wants conversion. Hotels want Instagram moments. Libraries want something quieter and harder to design for: they want a visitor to arrive curious and leave more capable. Every interactive element has to serve literacy, access, or community — or it doesn't belong.
This guide covers what works, what doesn't, and how to pay for it.
Who this is for: Library directors, technology coordinators, and grant writers at public, academic, and research libraries planning space modernization with interactive technology.
Key Takeaways
- Interactive installations in libraries range from $50K single-room projections to $5M+ campus-scale digital transformations — often 100% grant-fundable
- US public libraries manage $14–15 billion in annual budgets, with average technology spending rising to $467K per library in 2024 (up 15% year-over-year)
- IMLS/LSTA grants alone distribute $177–180 million annually to library systems for technology, digital literacy, and infrastructure
- Body-tracked, touchless, and projection-based interactions are replacing touchscreens — better for hygiene, durability, and the "wow" factor that gets communities into the building
- Singapore's NLB, the Library of Congress, and the British Library are leading with AI storytelling rooms, interactive archive kiosks, and born-digital exhibitions
- The strongest installations make the collection the star — technology reveals what the stacks can't show, not what a screen can invent
- Libraries with immersive programming report 20–40% increases in program attendance and measurably higher community engagement scores
1. The Quiet Revolution — Why Libraries Are Different
1-1. The silence tension
Every institution that adds interactive technology faces a version of the same question. In zoos, it's "will visitors watch the screen instead of the animal?" In libraries, the question cuts deeper:
"Will technology turn our library into an arcade?"
It's the right question to ask. Libraries serve the widest demographic range of any public institution — toddlers at storytime, teenagers doing homework, job seekers writing resumes, seniors reading newspapers, researchers accessing archives. A projection mapping installation that delights a five-year-old could disturb a graduate student twenty meters away.
But the data tells a more nuanced story. The Public Library Association's 2023 Technology Survey found that 60.8% of US public libraries already maintain a dedicated budget line for public-access technology. Libraries aren't resisting technology — they're already investing in it. The question is whether that investment creates isolated computer terminals or integrated experiences that draw people deeper into the collection.
1-2. When technology enhances vs. competes
The difference comes down to design intent:
| Competes with the collection | Enhances the collection |
|---|---|
| Standalone gaming station unrelated to the library's holdings | Projection-mapped storytelling room that brings picture books to life |
| Generic touchscreen kiosk with a web browser | Gesture-based interface for browsing rare maps and manuscripts |
| VR headset that isolates the visitor from the space | Body-tracked wall that visualizes community reading data in real time |
| Digital signage showing ads or generic content | Interactive timeline of local history drawn from the library's own archives |
The installations that work treat technology as a bridge to the stacks, not a bypass around them. They make the visitor see the collection differently — not look away from it.
2. What Works — Proven Installation Types for Libraries
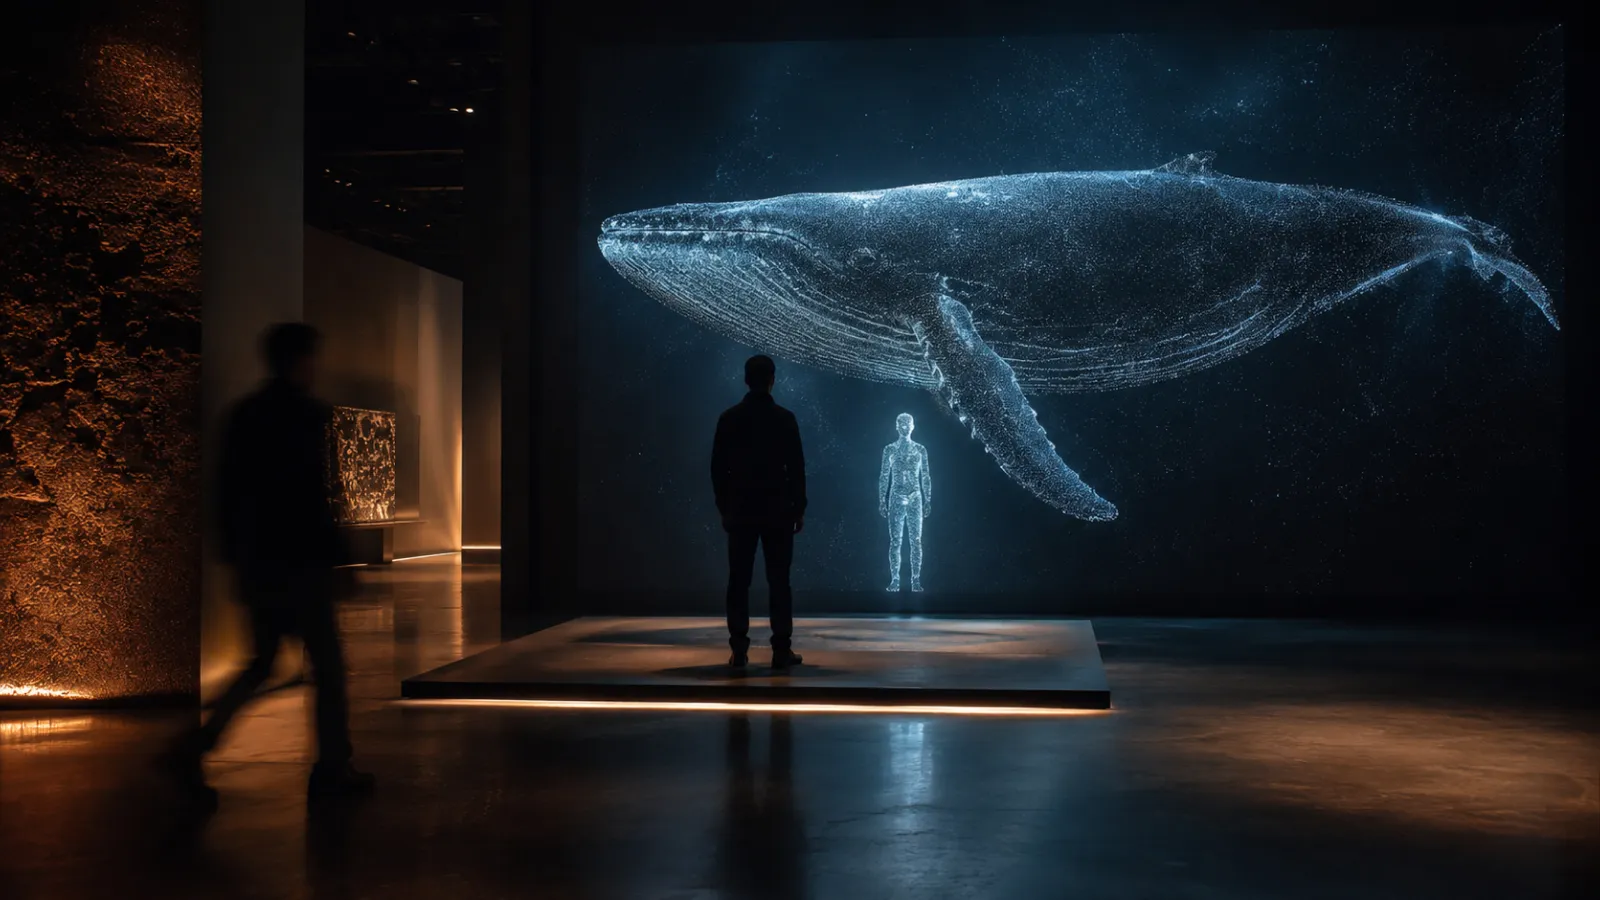
2-1. Immersive storytelling rooms
Projection-mapped spaces where stories surround the visitor — walls, floor, ceiling become the book.
This is the approach Singapore's National Library Board pioneered with their StoryGen Immersive Room (2024): a curved-wall projection environment where visitors choose a base story, customize characters and genre via generative AI, and watch their personalized narrative play out as a multimedia projection. The experience ends with a downloadable PDF — the story becomes a physical takeaway that connects back to the library's reading mission.
The same concept scales to different library contexts:
- Children's areas: picture books projected at room scale, with body tracking so kids physically interact with characters
- Teen spaces: collaborative story creation where multiple visitors contribute to a shared narrative wall
- Special collections: rare illustrated manuscripts projected floor-to-ceiling, revealing details invisible to the naked eye
Immersive storytelling rooms work because they don't compete with books — they make the visitor want to read more.
2-2. Interactive digital archive interfaces
Gesture-based or touchless browsing of rare collections, historical maps, photographs, and manuscripts — making inaccessible archives accessible without risk to originals.
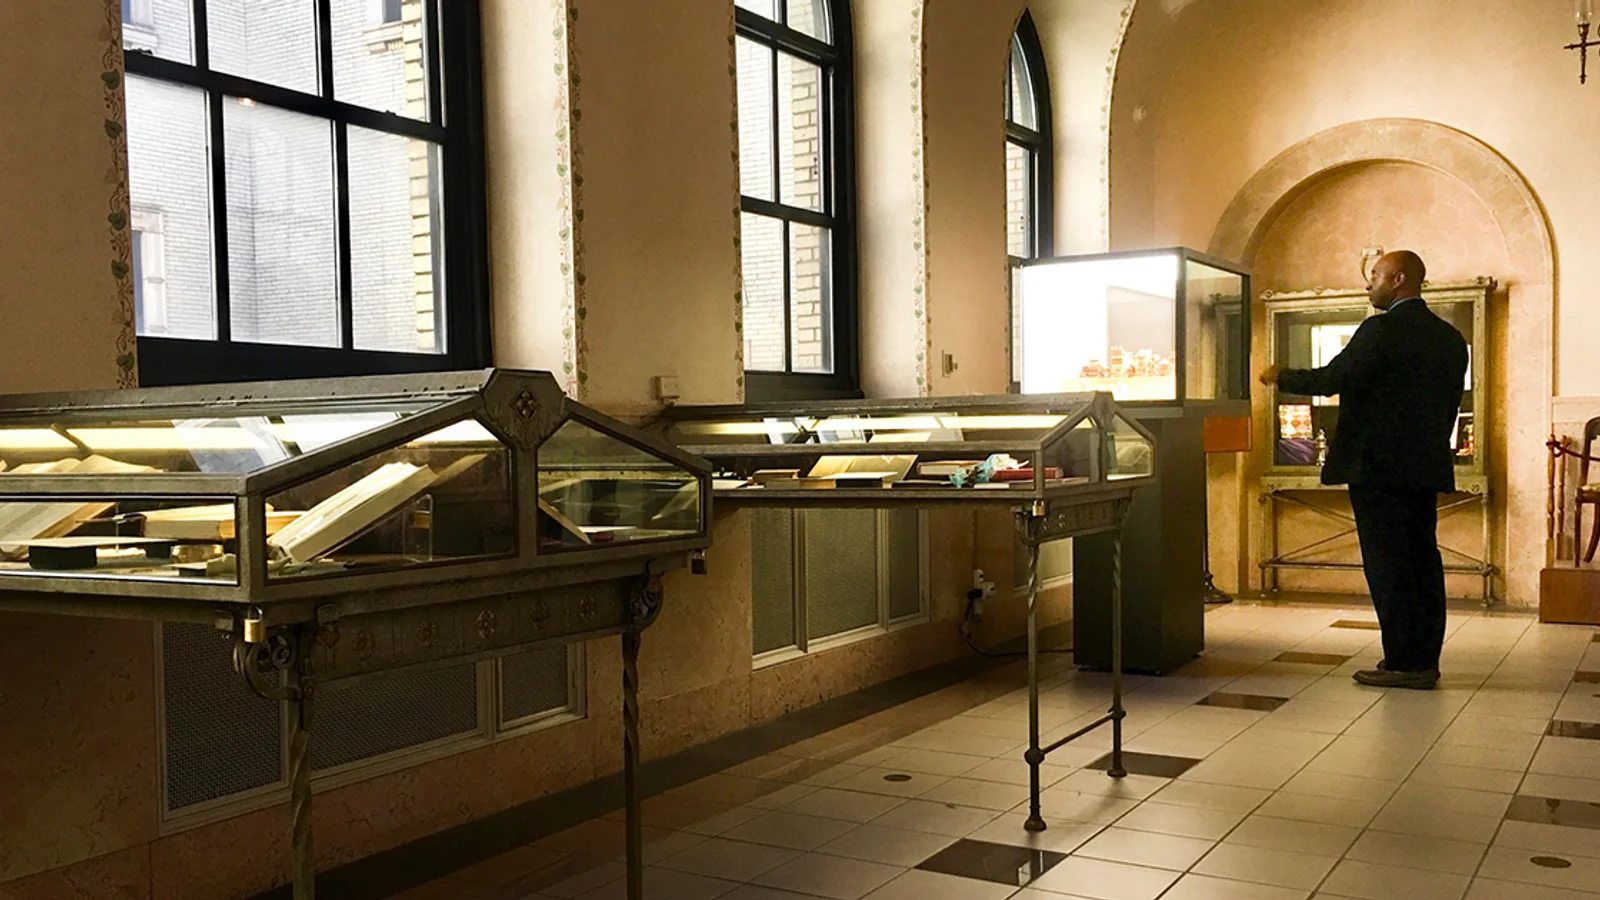
The Library of Congress's LOCal initiative (2025) partners with public libraries to co-create interactive digital experiences using LoC collections — Sanborn fire insurance maps, WPA posters, Veterans History Project recordings — displayed through interactive kiosks and immersive screens that connect national archives to local stories.
This type of installation works for:
- Research libraries with fragile collections that can't be handled
- Local history rooms where community archives deserve more than a filing cabinet
- University libraries connecting students to primary sources through spatial navigation instead of database queries
- Any library with a digitized collection that nobody knows exists
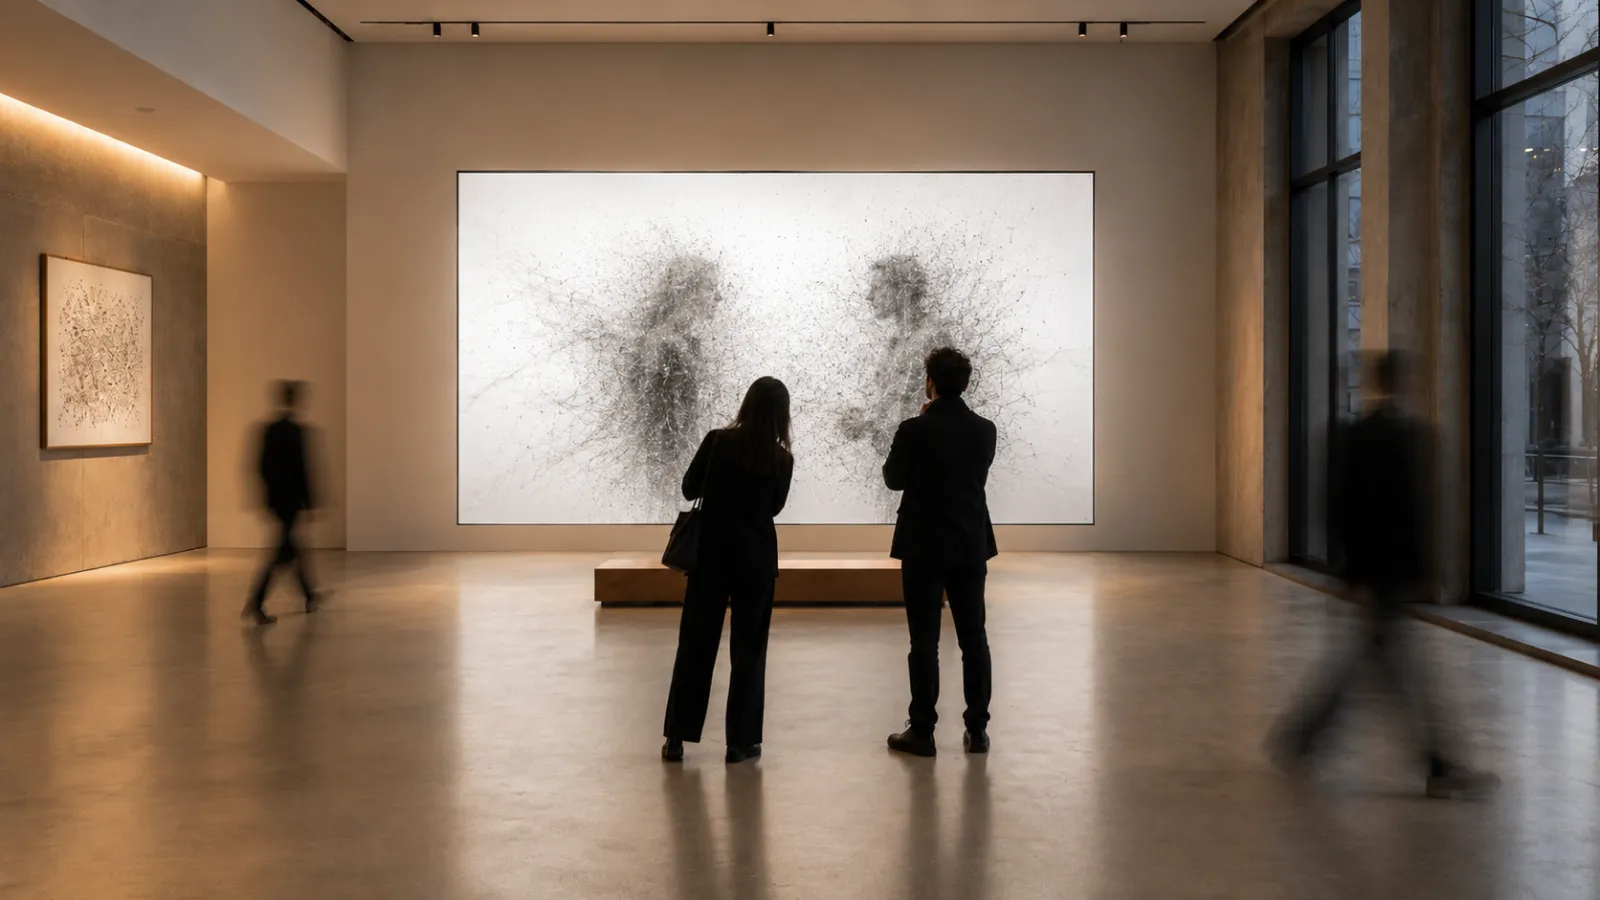
2-3. Community data visualization walls
Real-time displays that turn library usage data, community demographics, or reading trends into public art — making the invisible visible.
- Reading pulse: a living visualization showing what the community is reading right now — genres, authors, checkout velocity — without exposing individual data
- Local history timelines: interactive walls where visitors scrub through decades of neighborhood change using the library's photograph and newspaper archives
- Impact dashboards: program attendance, digital resource usage, community events — data that makes the case for library funding, displayed as art
These installations serve dual purposes: community engagement and advocacy. When a city council member walks through the library and sees real-time proof of community impact on a 3-meter wall, that's a budget conversation won without a PowerPoint.
2-4. Maker spaces with interactive digital tools
Libraries have led the maker movement since the early 2010s. The next evolution adds interactive installation thinking to maker programming.
Austin Public Library's APL Innovate (Central Library, 5th floor) offers collaborative studios for podcast production, 3D modeling (Blender, Cinema 4D), game development (Unity, Unreal Engine), and music production — with free monthly 3D printing for cardholders. Their #MadeAtAPL program showcases community creations.
Interactive installation elements in maker spaces include:
- Coding walls: large-format displays where visitors write and test code collaboratively
- Digital art stations: body-tracked creative tools that produce shareable visual art
- 3D scanning booths: visitors scan objects and see them rendered on-screen in real time
2-5. Wayfinding and discovery installations
Interactive recommendation systems and collection exploration tools that replace static catalog terminals with spatial, visual, and social discovery.
- Physical-digital browsing: touch or gesture-based interfaces that let visitors explore the collection by theme, mood, or visual similarity rather than Dewey Decimal
- "Staff picks" walls: rotating digital displays curated by librarians, with one-tap holds
- Community recommendation engines: visitors leave reviews and suggestions that appear on interactive displays near relevant shelving
These installations solve a fundamental library problem: discovery. Most visitors don't know what they want until they see it — and a card catalog doesn't inspire browsing.
3. Real Examples — Three Projects That Got It Right
3-1. Singapore National Library Board — StoryGen & Immersive Room
| Detail | Specification |
|---|---|
| Launched | January 2024 (Central Public Library), expanded to Punggol Regional Library |
| Budget | Undisclosed (rapid prototyping with GovTech/AWS) |
| Key tech | Generative AI (AWS), curved-wall immersive projection, kinetic sensors, gamification platforms |
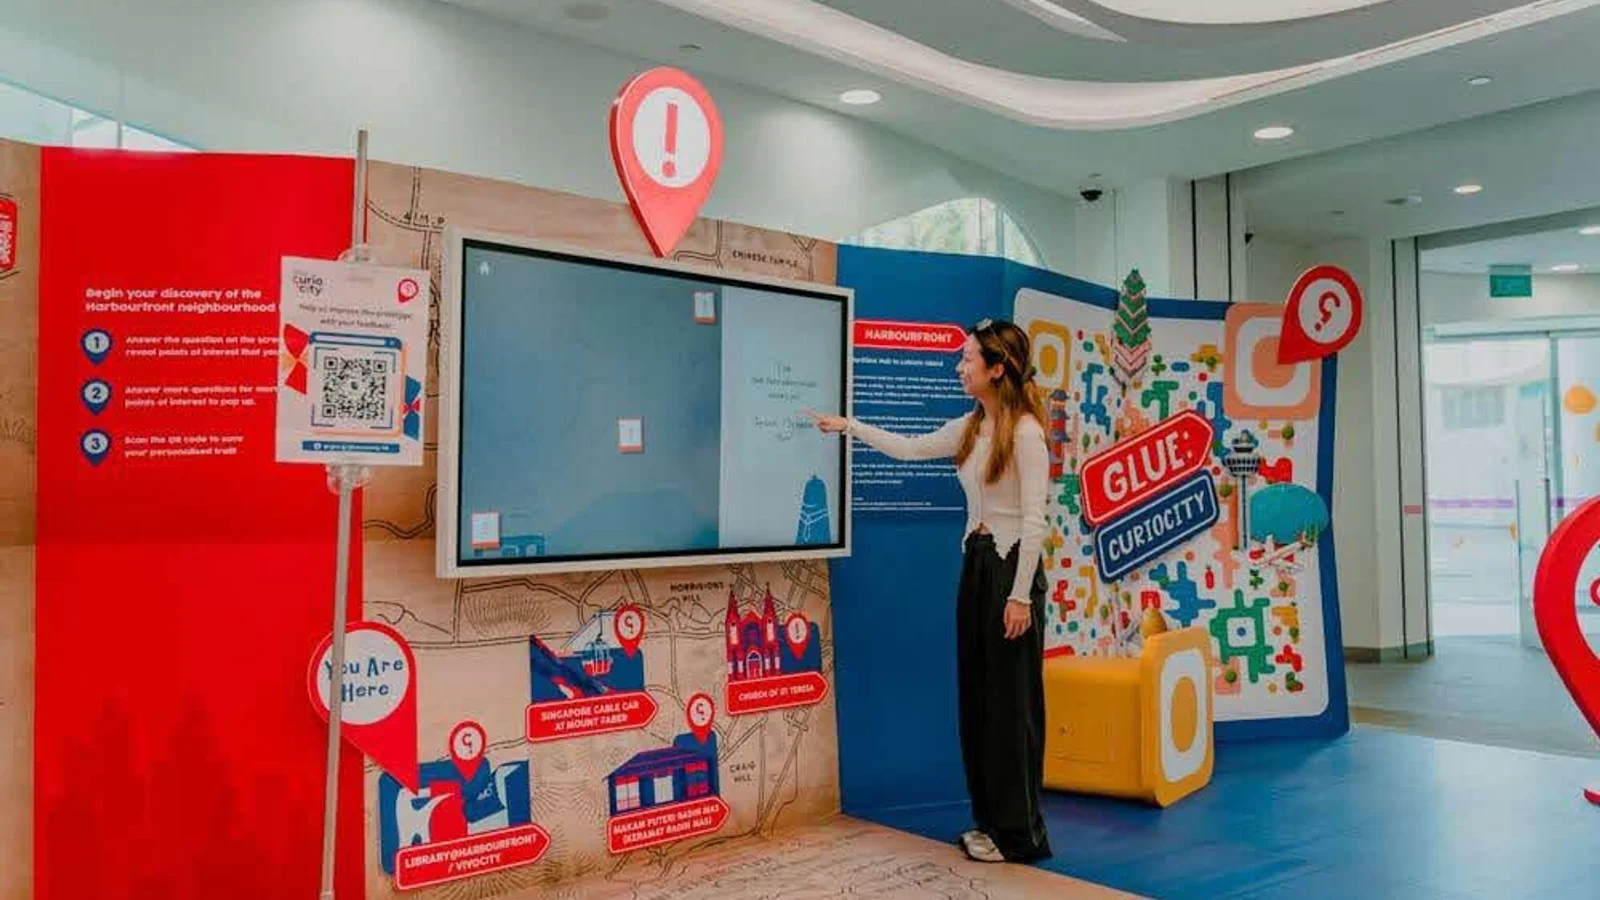
| Programs | StoryGen (AI storytelling), Glue: Curiocity (gamified local discovery), ChatBook (AI book conversations) |
| Impact | 1,090+ testers for ChatBook alone (600+ active); expanded to horror-themed edition at Haw Par Villa; part of LAB25 national blueprint |
Singapore's NLB runs the most ambitious library technology program globally. StoryGen transforms a dedicated Immersive Room into a storytelling environment where visitors customize classic narratives — The Wizard of Oz, legends from the Malay Annals — by selecting characters, genres, locations, and endings. The AI generates a complete story visualized through projection, and visitors download a PDF to take home.
What makes it work: every output connects back to reading. The AI-generated story is a gateway, not a destination. Visitors leave with a personalized narrative and — critically — exposure to source texts they might never have discovered.
3-2. Library of Congress — LOCal & The Source
| Detail | Specification |
|---|---|
| Timeline | LOCal: launched 2025, installations expected 2026. The Source: opened April 2026 (developed 2023–2025) |
| Budget | Carnegie Corporation grants (amounts undisclosed) |
| Partners | Eastern Oklahoma Library System, Cleveland Public Library |
| Key tech | Interactive kiosks, immersive screens, digital reconstruction, VR/ML-informed interfaces |
| The Source | 4,000 sq ft experiential gallery in Thomas Jefferson Building; ages 8–15; researcher boxes, archive drawers (film/sound), media literacy activities, life-size librarian videos |
LOCal creates interactive digital experiences that connect LoC's massive digital collections — Sanborn maps, WPA posters, Veterans History Project — to local community stories through partner libraries. Each installation is co-designed with the local library to reflect its community's history and needs.
The Source targets young researchers with four zones: researcher boxes tracing real research paths (e.g., following 1970s New York documents through Meg Medina's work), film and sound archive drawers, media literacy activities, and life-size videos of librarians explaining their work.
What makes it work: the technology serves research skills, not entertainment. Visitors don't just consume — they learn to investigate.
3-3. British Library — Digital Storytelling Exhibition
| Detail | Specification |
|---|---|
| Dates | June–October 2023 |
| Format | Small gallery exhibition, 11 born-digital interactive works |
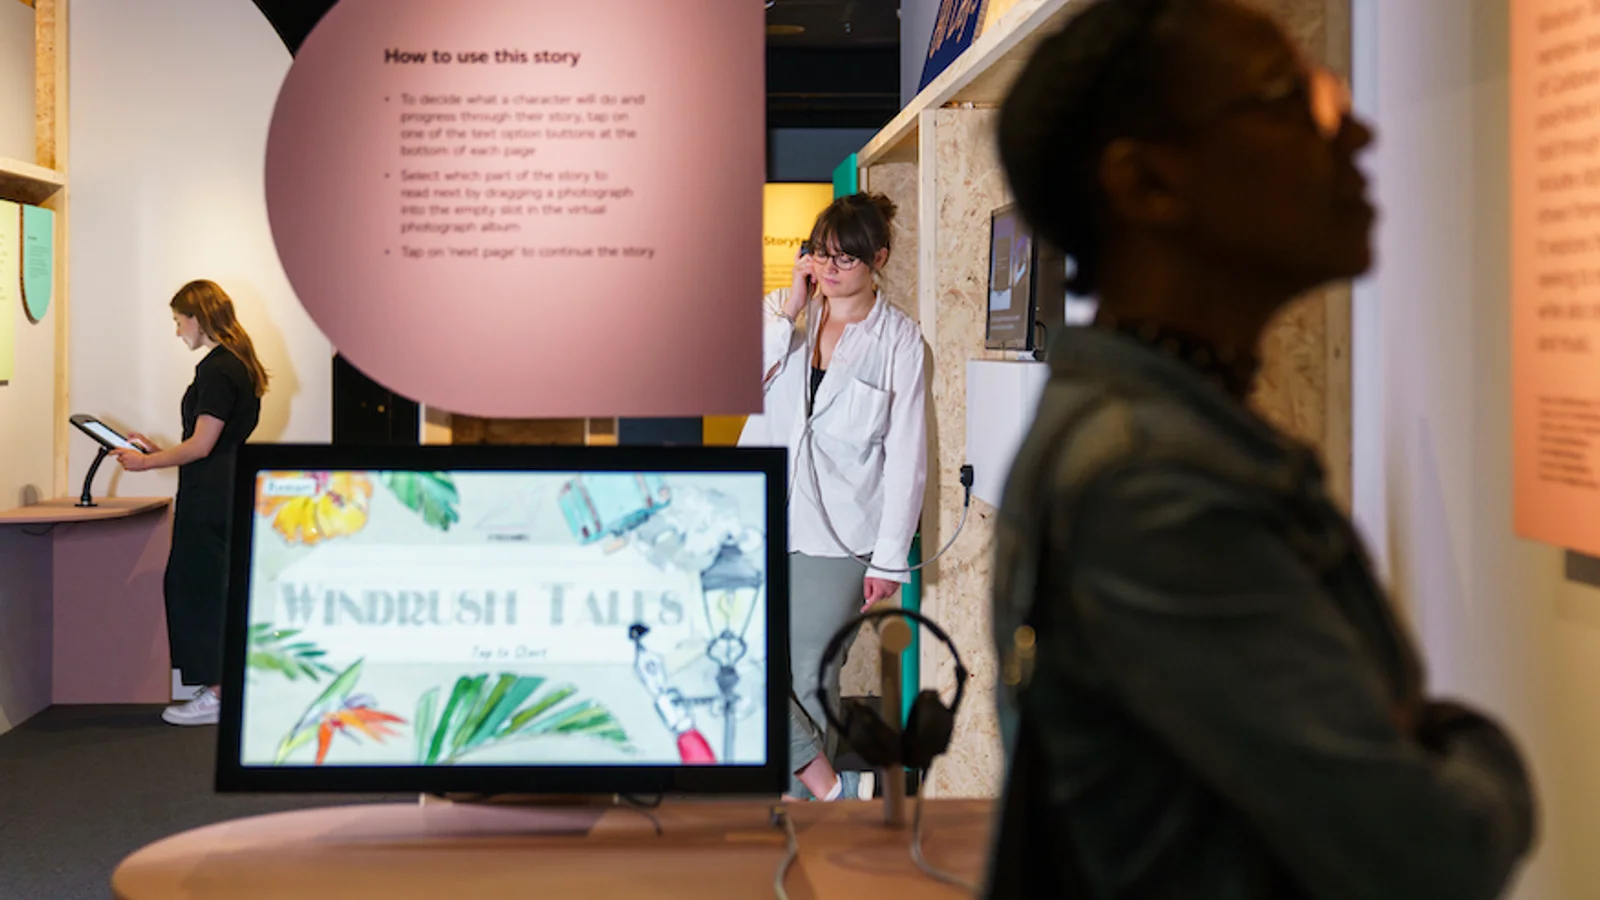
| Key tech | Location-based audio (Zombies, Run!), adaptive narratives (Breathe — changes by time/place), virtual photo albums (Windrush stories), weather-generated poetry |
| Entry | £9 adult admission |
The British Library's Digital Storytelling exhibition showcased interactive works that reinvent what "reading" means: a zombie survival audio game triggered by your physical location, a ghost story that adapts its narrative based on time of day and weather, virtual photo albums preserving Windrush community stories, and poetry generated by real-time weather data.
What makes it work: it treats born-digital storytelling as a legitimate literary form deserving exhibition alongside manuscripts and first editions. The library's curatorial authority gives interactive work credibility it wouldn't have in a tech showroom.
4. Literacy & Community Impact — Making the Mission Tangible
The strongest argument for interactive installations in libraries isn't foot traffic — it's measurable impact on the library's core mission.
4-1. Interactive experiences deepen engagement
Libraries that have implemented immersive programming report significant increases in both quantity and quality of engagement:
- Program attendance: immersive storytelling sessions and interactive exhibits consistently outperform traditional programming, with libraries reporting 20–40% higher attendance for tech-enhanced programs
- Dwell time: visitors spend 2–4x longer in spaces with interactive elements compared to traditional reading rooms or static displays
- Demographic reach: interactive installations attract demographics that traditional library programming misses — particularly teens and young adults
This aligns with the neuroscience of digital awe — immersive experiences activate mirror neurons and spatial presence, creating emotional connections that static media can't match.
4-2. Data visualization makes impact visible
Interactive installations can turn abstract library impact data into visceral, public displays:
- Literacy metrics: real-time visualization of community reading levels, program completion rates, and educational outcomes
- Collection usage: animated displays showing which subjects, authors, and formats are trending across the system
- Community stories: interactive walls where patrons share what the library means to them — projected, shareable, archived
4-3. Call-to-action integration
The best library tech doesn't just inform — it prompts participation:
- Reading challenges embedded in interactive exhibits (scan a book, log it on the wall)
- Program signup at the point of inspiration (touch to register for a related workshop)
- Donation moments tied to impact visualization ("This library served 50,000 visitors this year — help us reach 60,000")
- Card registration integrated into the experience (start interacting → prompted to get a card for full access)
5. Budget & Funding — What Library Tech Actually Costs
5-1. Budget tiers
| Tier | Budget range | What you get | Example |
|---|---|---|---|
| Single-room refresh | $50K–$200K | Projection mapping in one children's area or storytelling room, single interactive station | Children's storytime projection room |
| Branch-scale digital | $200K–$1M | 2–5 interactive stations, projection-mapped environment, community data wall | Branch library maker space + interactive archive display |
| Signature installation | $1M–$5M | Full experiential zone with integrated interactives, immersive environments, custom hardware | Immersive Room (Singapore NLB-style) with multiple interaction modes |
| Campus-scale transformation | $5M–$50M+ | Multi-zone interactive campus, gamified exploration, dozens of digital touchpoints | Full central library renovation with integrated technology throughout |
Digital and AV components typically represent 15–30% of total renovation costs, with the rest going to construction, furniture, HVAC, and infrastructure.
5-2. Government funding sources
This is where libraries have a massive advantage over every other venue type. Libraries are publicly funded institutions with access to dedicated federal, state, and local technology grants that museums, hotels, and retail spaces cannot tap.
| Source | Typical contribution | Notes |
|---|---|---|
| IMLS/LSTA formula grants | $177–180M/year nationally | Distributed to every state; supports technology, digital literacy, infrastructure. Apply through your State Library Agency |
| IMLS National Leadership Grants | $75K–$1M per award | Competitive; for innovative technology models and community engagement. Strong fit for interactive installations |
| E-Rate Program | 20–90% discount on broadband/connectivity | $3.9B+ annual cap (shared with schools). 52% of libraries applied in FY2023. Requires CIPA compliance |
| NEA/NEH grants | $10K–$500K per award | Arts and humanities projects with tech components — digital exhibits, interactive archives, cultural programming |
| State library construction grants | Varies widely | NY State: $34M across 207 projects (2024); many states have dedicated library capital programs |
| Local bonds and levies | 80–90% of library capital funding | Property tax levies, dedicated library districts, municipal bonds |
| Carnegie Corporation / philanthropic | Project-specific | Library of Congress LOCal funded by Carnegie; many foundations prioritize library innovation |
Key insight: A well-written IMLS grant application can fund an entire interactive installation. Unlike zoos or museums that rely heavily on capital campaigns and ticket revenue, libraries can build the case for federal funding because they serve universal public access — the exact mission IMLS exists to support.
For a deeper dive on installation budgets across venue types, see our complete budget guide.
5-3. ROI metrics that matter for libraries
Libraries don't sell tickets, so ROI looks different:
- Foot traffic lift: visits to the branch or zone after installation opening
- Program attendance: participation rates for programs tied to interactive exhibits
- Card registrations: new library cards issued, particularly among underserved demographics
- Dwell time: time spent in the library per visit
- Digital resource usage: checkouts, database access, streaming from interactive discovery tools
- Community engagement scores: survey-measured satisfaction, sense of belonging, perceived value
- Grant renewal success: documented impact from interactive programs strengthens future funding applications
- Advocacy impact: council members, funders, and community leaders who experience the installation firsthand become advocates
6. Compliance & Guidelines — ADA, ALA, and CIPA
6-1. ADA Title II — the April 2026 deadline
Public libraries are government entities subject to ADA Title II, which now explicitly covers digital accessibility. The April 2026 compliance deadline means every interactive installation in a public library must meet WCAG 2.1 AA standards.
This isn't optional. It shapes every design decision:
- Multiple interaction modes: every touchscreen must have a keyboard/switch alternative
- Audio descriptions: every visual experience must have an audio equivalent
- Physical accessibility: all stations reachable from a wheelchair, with adjustable heights
- Cognitive accessibility: clear wayfinding, simple instructions, multiple languages
For a complete accessibility framework for interactive installations, see our accessibility guide.
6-2. ALA technology guidelines
The American Library Association doesn't prescribe specific technologies but provides interpretive guidelines under the Library Bill of Rights:
- Equitable access: technology must not create barriers based on ability, language, or economic status
- Privacy: interactive installations must not collect personally identifiable information without consent. Anonymous usage data is acceptable; facial recognition is not
- Intellectual freedom: content filtering on interactive stations must follow the same principles as collection development — no viewpoint-based restrictions
6-3. CIPA — Children's Internet Protection Act
Libraries receiving E-Rate or certain LSTA funds must comply with CIPA:
- Internet safety policies adopted and enforced
- Technology protection measures (content filters) on computers accessible to minors
- Public hearing held before policy adoption
For interactive installations: if the installation connects to the internet (e.g., AI-powered storytelling, real-time data visualization), CIPA filtering requirements apply in children's areas. Design around this by using curated, pre-approved content libraries rather than open internet access.
6-4. Practical constraints for tech in libraries
| Constraint | What it means for installation design |
|---|---|
| Sound | Libraries have strict noise expectations. Use directional speakers, sound-dampening enclosures, or silent interactions. Zone acoustically — immersive rooms need soundproofing |
| Light | Bright projections near reading areas cause glare and distraction. Use ambient light sensors and auto-dimming. Dark immersive rooms need transition zones |
| Privacy | No cameras or sensors that capture identifiable visitor data. Body tracking must use anonymized skeletal data only |
| Hours | Libraries often run 60–70 hours/week with minimal evening staff. Installations must auto-start, auto-shutdown, and self-recover from errors |
| Accessibility | ADA Title II compliance is non-negotiable. Every interaction mode needs an accessible alternative |
| Multi-generational use | Design for ages 3–93. No assumed tech literacy. No required accounts or apps |
For detailed guidance on acoustic design in public spaces, see our sound design guide.
7. Technical Requirements — Hardware That Survives a Public Library
7-1. Environmental considerations
Public libraries are gentler environments than zoos or outdoor venues, but they present unique challenges:
| Challenge | Solution |
|---|---|
| High daily traffic (500–5,000+ visitors/day in central libraries) | Commercial-grade displays rated for 16+ hours/day continuous operation |
| Unsupervised children | Tamper-proof mounting, no exposed cables, polycarbonate glazing over screens |
| Cleaning requirements | Surfaces rated for daily sanitization with standard cleaning products |
| Climate control variability | Indoor-rated equipment with active cooling for enclosed projection spaces |
| Power stability | UPS systems for media players; graceful shutdown on power loss |
7-2. Public use durability
- No moving parts where possible — body tracking and projection eliminate physical wear
- Touch surfaces rated for 50M+ touches if using touchscreens
- Tamper-proof mounting with security screws and recessed panels
- No exposed cables — all routing through conduit or behind walls
- Auto-restart capability — media players that recover from crashes without staff intervention
7-3. Maintenance and uptime
| Requirement | Recommendation |
|---|---|
| Uptime target | 98%+ during operating hours |
| Remote monitoring | Dashboard for all AV systems with automated alerts to IT staff |
| Content management | CMS for updating visuals, data, and messaging without on-site technician |
| Spare parts | On-site stock of critical components (media players, cables, projector lamps) |
| Service contract | Annual maintenance agreement with installation studio; 24-hour response SLA |
| Staff training | Basic troubleshooting guide for circulation desk staff (restart procedures, escalation contacts) |
8. Common Pitfalls
1. Technology overshadowing the collection The installation becomes the reason to visit, not the books. Solution: design every interactive to point back to a physical item, a reading list, or a library program. If a visitor can fully experience the installation without engaging with the collection, redesign.
2. Ignoring acoustics Sound from interactive stations bleeds into reading areas and study spaces. Solution: invest in directional speakers, soundproofed rooms, and acoustic zoning from day one. Retrofitting acoustics is 3–5x more expensive than designing for it. See our sound design guide for detailed guidance.
3. Underestimating accessibility requirements Interactive stations at a single height, no audio descriptions, no alternatives for wheelchair users or visitors with cognitive disabilities. ADA Title II compliance isn't a nice-to-have — it's a legal requirement with a 2026 deadline. Follow our accessibility guide for a complete framework.
4. Building for opening day, not year five Installations that can't be updated become stale. Insist on a content management system that allows non-technical library staff to refresh content, add new collections, and update community data without calling the vendor.
5. Forgetting the grant reporting requirements Federal grants require measurable outcomes and reporting. If you don't build usage tracking (anonymous) into the installation from the start, you'll struggle to document impact for IMLS/LSTA renewals. Design analytics dashboards that generate the data your grants require.
6. Ignoring staff buy-in Librarians who weren't consulted during design will resent maintaining technology they don't understand. Involve frontline staff from concept phase. Their knowledge of patron behavior is more valuable than any consultant's market research.
9. How to Get Started — From Grant Application to Opening Day
9-1. Typical timeline
| Phase | Duration | Key activities |
|---|---|---|
| Needs assessment & grant writing | 2–4 months | Audit current spaces, define goals, identify funding sources, write IMLS/LSTA application |
| Design development | 3–6 months | Schematic design, tech selection, AV engineering, accessibility review, community input sessions |
| Fabrication & build | 3–6 months | Hardware procurement, software development, custom fabrication |
| Installation & commissioning | 1–2 months | On-site install, integration testing, staff training |
| Soft opening & iteration | 1–2 months | Patron testing, data collection, adjustments, grant reporting setup |
Total: 10–20 months from concept to public opening, depending on scale and grant timelines.
Note: IMLS grant cycles typically have spring deadlines with awards announced in fall. Factor this into your timeline — a 6-month grant waiting period is normal.
9-2. Your first steps
- Audit your spaces — which areas have the highest foot traffic but lowest engagement? Children's rooms with dated equipment, underused local history rooms, and empty community spaces are your opportunities.
- Define the literacy mission — every interactive should answer: "What do we want patrons to feel, know, and do after this experience?"
- Identify funding — check your State Library Agency for current LSTA priorities. Review IMLS National Leadership Grant guidelines. Talk to your E-Rate coordinator.
- Set a realistic budget — include 10–15% annual maintenance and a content refresh cycle.
- Brief a studio — see our guide to briefing an interactive installation studio for a template that works for library contexts.
Context:
- Library type: [public / academic / research / special]
- Annual visitors: [number]
- Target space: [children's area / local history room / maker space / lobby / branch library]
- Current state: [describe what's there now]
- Budget range: [estimate, or "seeking grants"]
- Timeline: [when do you need it open?]
- Mission focus: [literacy / community engagement / archive access / STEM education]
Please help me:
- Define 3 clear objectives tied to the library's strategic plan
- Identify the best interaction type for our space, audience, and mission
- List 3 relevant federal/state grant programs with current deadlines
- Create a phased timeline with milestones
- Draft an outcomes measurement plan for grant reporting
- List questions to ask potential studio partners
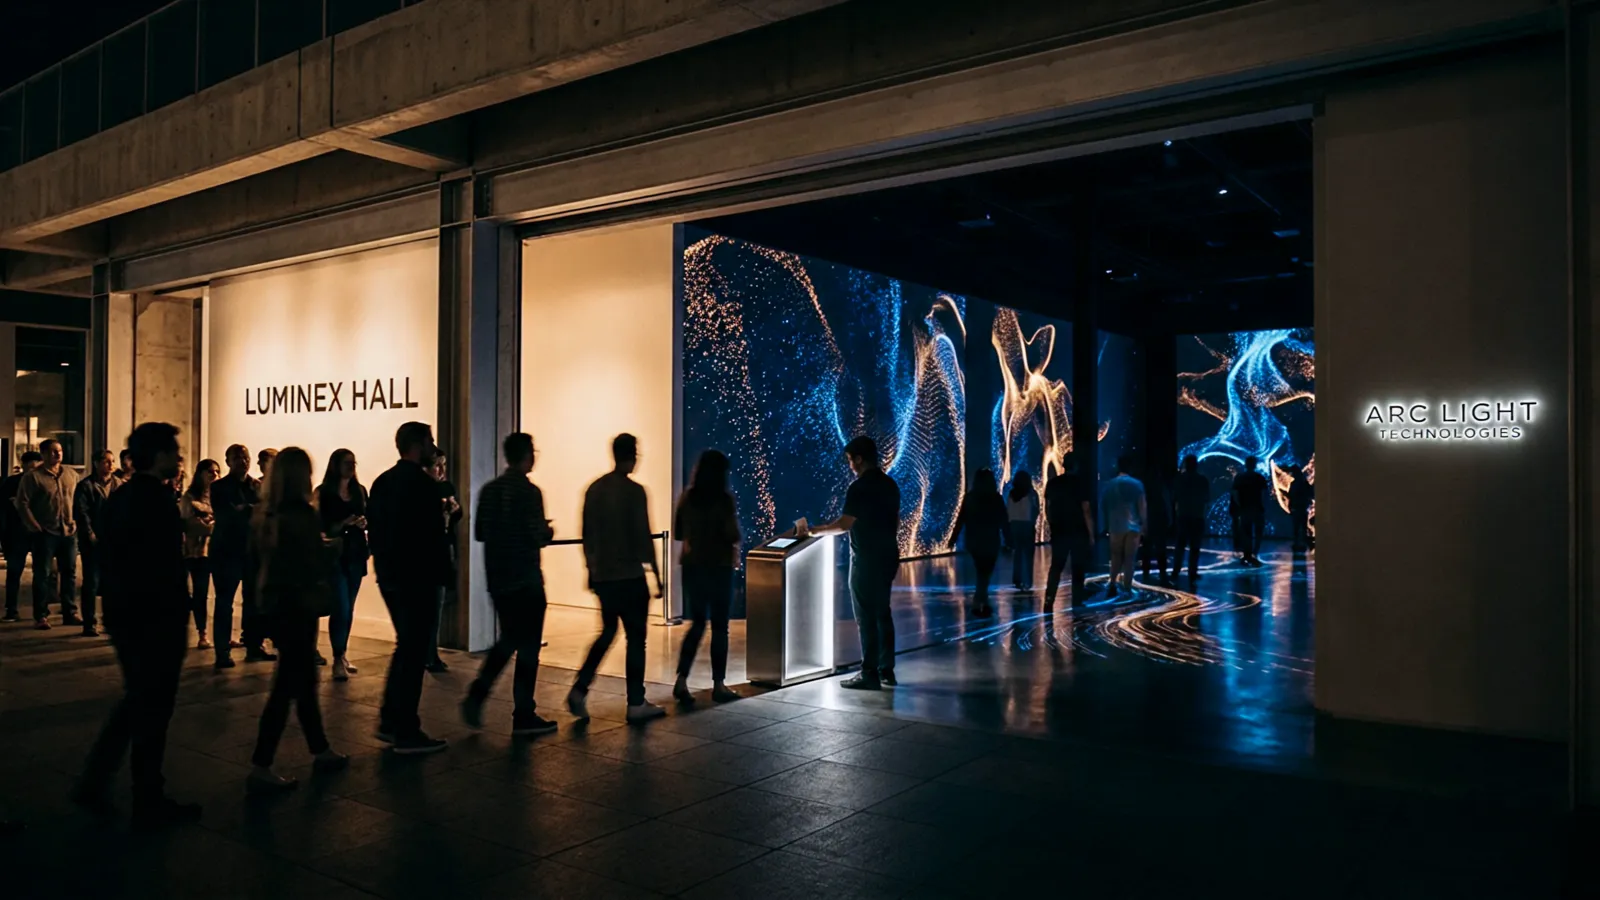
10. About Utsubo
Utsubo is an interactive creative studio specializing in body-tracked installations, real-time 3D experiences, and WebGPU-powered visual systems.
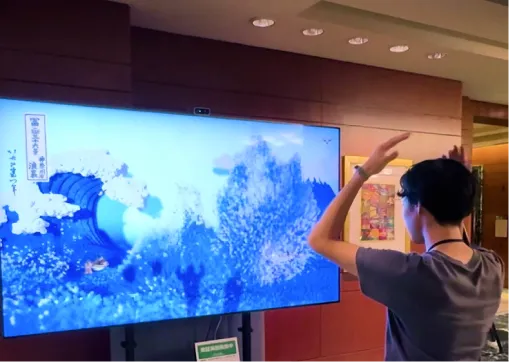
Our Waves of Connection installation at Expo 2025 Osaka — a body-tracked piece where visitors moved a million-particle Great Wave using their gestures — demonstrated the kind of touchless, high-impact interaction that translates directly to library environments:
- No touchscreen, no controller — visitors interact with their body
- Multi-user — up to 6 people tracked simultaneously
- All ages — children and seniors engage intuitively, without instructions
- Durable — no moving parts, no surfaces to clean or break
- Silent operation — fully compatible with quiet library environments
We combine Three.js and WebGPU expertise with physical installation design to create experiences that work in demanding public environments.
11. Let's Talk
Planning a library space refresh with interactive technology? We work with institutions on immersive experiences that put the collection and community mission first.
If you're exploring a partnership, let's discuss your project:
- What you're building and the constraints you're working with
- Which technical approach makes sense for your space and community
- Whether we're the right fit to help you execute
Checklist: Interactive Installation for Libraries
- Literacy or community mission defined for each interactive element
- Needs assessment completed with frontline library staff
- ADA Title II / WCAG 2.1 AA compliance plan in place
- CIPA compliance verified for any internet-connected installations in children's areas
- ALA privacy guidelines reviewed for data collection practices
- Grant funding identified and application timeline mapped
- Budget includes 10–15% annual maintenance allocation
- Acoustic design reviewed — sound isolation from quiet zones confirmed
- Content management system specified for non-technical staff updates
- Anonymous usage analytics built in for grant reporting
- Staff training plan included in project scope
- Soft opening period scheduled for patron testing and iteration
FAQs
How much does an interactive installation cost for a library?
Budgets range from $50K for a single children's storytelling projection to $5M+ for a campus-scale digital transformation. A typical branch-scale installation with 2–5 interactive stations runs $200K–$1M. Digital and AV components usually represent 15–30% of total renovation cost. Unlike museums or retail, many library installations are 100% grant-fundable through IMLS, LSTA, and state programs.
Can libraries get grants to pay for interactive installations?
Yes — and this is libraries' biggest advantage. IMLS distributes $177–180 million annually through LSTA formula grants for library technology. National Leadership Grants offer $75K–$1M for innovative projects. E-Rate provides 20–90% discounts on connectivity infrastructure. NEA and NEH fund arts and humanities tech projects. State library agencies often have additional capital programs. A well-written grant application can cover the entire installation cost.
Won't interactive technology make the library too noisy?
Not if you design for acoustics from the start. Use directional speakers that contain sound to a specific zone, build soundproofed immersive rooms with proper transitions, and choose silent interaction modes (body tracking, gesture control) over audio-heavy experiences. The best library installations are quieter than a children's storytime session.
What about ADA compliance for interactive installations?
Public libraries must meet ADA Title II requirements, with an April 2026 deadline for digital accessibility (WCAG 2.1 AA). Every interactive element needs multiple interaction modes (touch, keyboard, switch), audio descriptions for visual content, wheelchair-accessible heights, and cognitive accessibility features. Plan for this from day one — retrofitting accessibility is far more expensive than designing for it.
How long does it take to develop an interactive installation for a library?
From concept to public opening, expect 10–20 months depending on scale. A single-room projection refresh can be completed in 6–8 months. Factor in grant application timelines: IMLS cycles typically add 6 months between application and award notification. A full central library digital transformation may take 2–3 years including planning and construction.
Do we need dedicated staff to maintain interactive installations?
Most modern installations run unattended during operating hours with automated startup/shutdown and remote monitoring. You'll need: IT staff or an AV contractor for weekly checks, CMS-trained staff for content updates, and a service contract with the installation studio for hardware issues. Budget 0.25–0.5 FTE for ongoing support of a medium-scale installation — less than a zoo or museum because library environments are climate-controlled and gentler on equipment.
What's the best interactive technology for children's library areas?
Projection mapping and body tracking are ideal for children's areas — they create magical experiences without fragile touchscreens or devices that need sanitizing. Immersive storytelling rooms (like Singapore NLB's StoryGen) let children interact with stories physically. Draw-and-project stations work well for creative engagement. Avoid VR headsets for children under 13 (hygiene, safety, and COPPA considerations). See our children's museum guide for age-appropriate design frameworks.
How do we measure ROI when there's no ticket revenue?
Libraries measure impact differently: foot traffic lift, program attendance increases, new library card registrations, dwell time, digital resource usage, and community engagement survey scores. For grant-funded installations, build anonymous usage analytics into the design from the start — IMLS and LSTA renewals require documented outcomes. The strongest ROI metric for libraries is often political: when community leaders experience the installation firsthand, they become advocates for library funding.
 Osaka Interactive Installation Studio