Museums aren’t just places to look—they’re places to do.
Interactive installations invite visitors to touch, move, and make choices that shape the story. Done well, they increase dwell time, improve learning outcomes, and turn one-off visits into memberships, donations, and word-of-mouth. This shift reflects a broader trend: the experience economy has made "doing" more valuable than "looking." For spaces serving younger audiences, see our children's museum installation guide.
Who this is for: Directors, curators, education teams, visitor experience leads, and exhibition designers evaluating interactive media for new or renewing galleries.
Key Takeaways
- Budget: Single-station interactives start ~$20K; room-scale installations can reach $150K+
- Timeline: Plan 8–24 weeks from discovery to installation
- ROI metrics: Stop rate, dwell time, completion rate, replay rate, downstream conversions
- Format choice: Match format to constraints—throughput, noise tolerance, accessibility needs, staff capacity
- Stakeholder buy-in: Involve curatorial, education, facilities, conservation, and IT early
- Maintenance matters: Remote monitoring + spares strategy prevents embarrassing downtime
- Accessibility: Multiple input modes (touch, motion, voice) expand your audience and meet compliance
Planning Snapshot
What it is
An interactive museum installation is an exhibit element that responds to visitor input (touch, motion, choices, device, presence) to reveal media, tasks, or narrative outcomes.
Typical budget
- Single-station interactive: ~$20K–$50K USD
- Multi-station zone / room-scale: ~$40K–$150K+ USD
- Post-launch updates: usually handled via a support plan (content refresh + maintenance)
Typical timeline
Most projects run 8–24 weeks depending on approvals, fabrication, and testing.
What to measure (to prove ROI)
- Stop rate (passersby → stoppers)
- Dwell time (how long visitors stay)
- Completion rate (start → finish)
- Replay rate (repeat attempts)
- Downstream actions (QR scans → signups/memberships, store/retail lift, donations prompts)
If you already have visitor analytics, plan to use your own baseline. If you don’t, we can set up privacy-first measurement from day one.
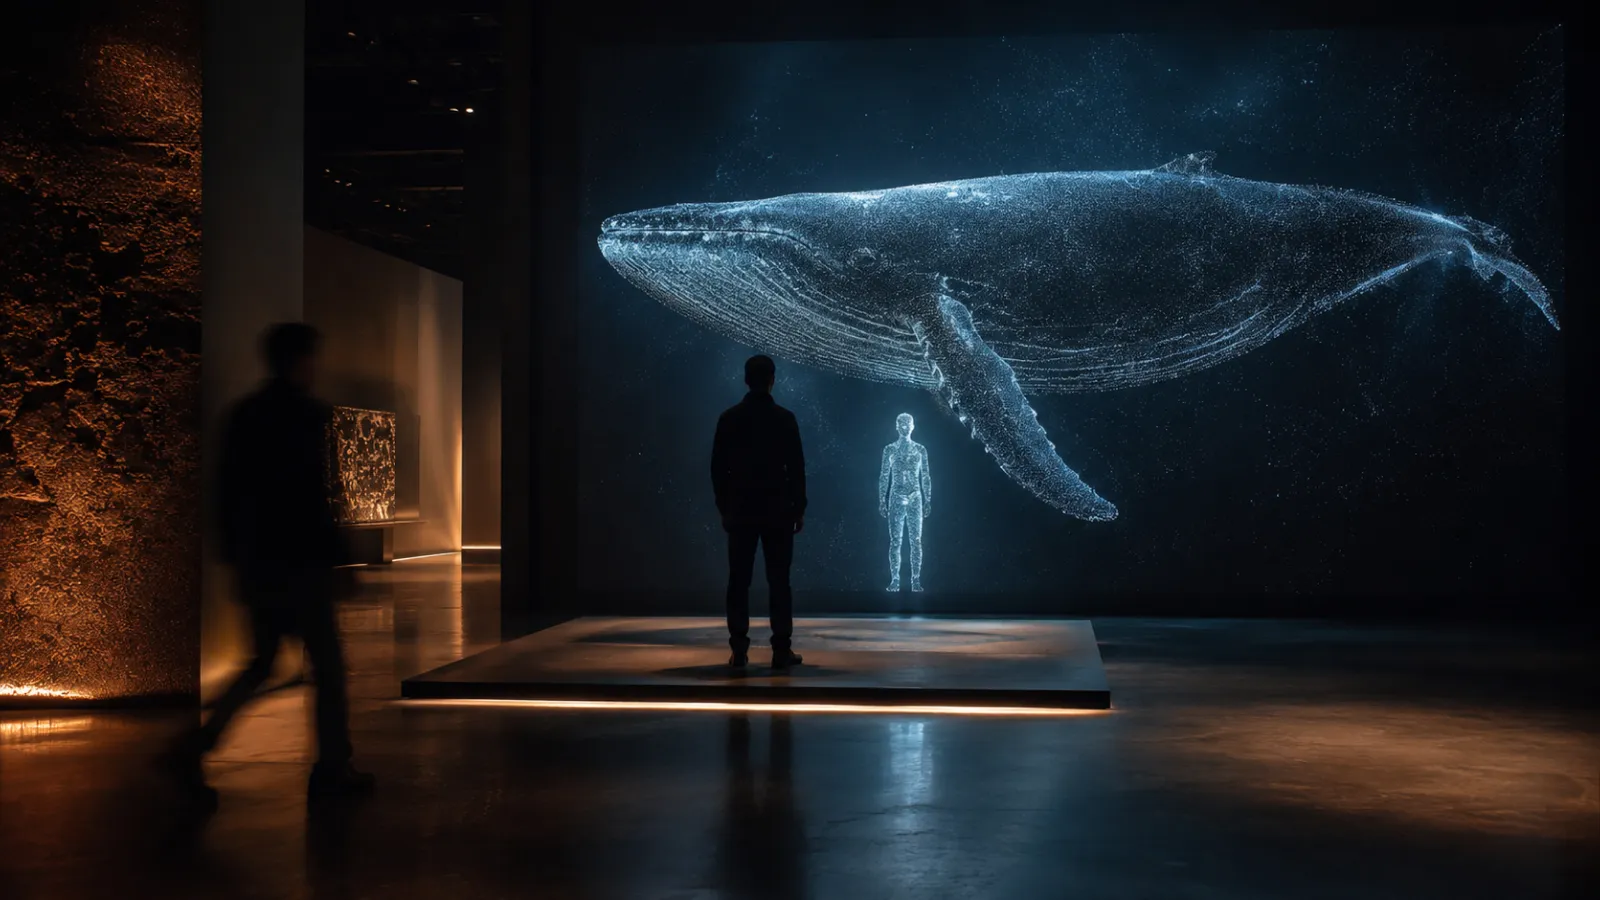
What Is an Interactive Museum Installation?
An interactive installation is an exhibit element that responds to visitor input—touch, motion, voice, device, or presence—to reveal media, narratives, or tasks.
The aim isn’t novelty; it’s agency:
- “I did something”
- “The exhibit reacted to me”
- “I understand this better now”
Common ingredients
- Responsive software (kiosks, touch tables, WebGL/WebGPU)
- Sensors (touch, motion, depth, RFID, CV presence)
- Media layers (video, AR overlays, spatial audio)
- Tactile models and physical computing (haptics, 3D prints)
- A CMS so curators can update content without developers
When It Makes Sense (and When It Doesn't)
Strong fit
- You want to increase engagement in a specific gallery (e.g., a "dead zone" visitors walk past)
- You need better learning outcomes for families or school groups (hands-on beats wall text)
- You have complex context to communicate—maps, timelines, reconstructions, or layered narratives
- You want shareable moments that generate social media and word-of-mouth
- You need measurable outcomes for grants, boards, or sponsors (not just "it looks great")
Be careful if…
- Your space has extreme throughput constraints with no room for queuing (solution: design for short cycles or parallel stations)
- Your team can't support basic daily checks (solution: fully managed support plan with remote monitoring)
- Conservation requirements restrict light/sound/vibration (solution: involve conservators early; many constraints are solvable)
Formats and How to Choose the Right One
Format Deep-Dive
Touch Tables & Kiosks Multi-user surfaces for exploration-at-your-own-pace. Visitors browse collections, navigate maps, follow timelines, or answer quiz questions.
- Strengths: High information density; self-paced; supports accessibility features; works in ambient light
- Limitations: Requires visitors to approach and engage; can bottleneck with single-user kiosks
- Best for: Collection browsers, interactive maps, timeline explorers, quiz-based learning
- Example: Cleveland Museum of Art's ArtLens touch tables
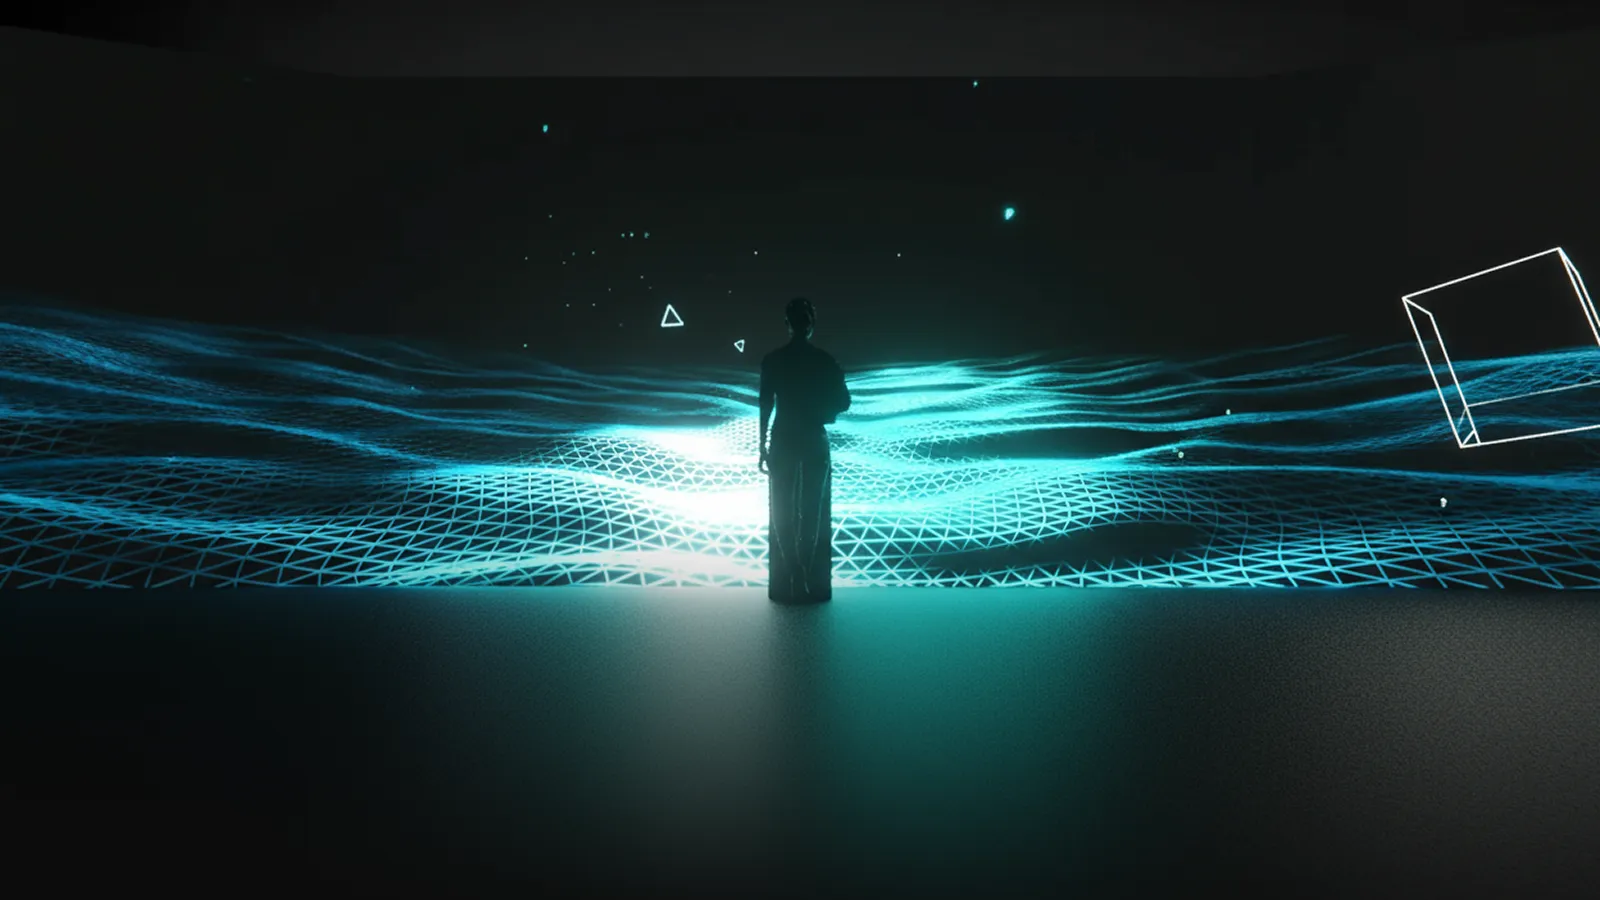
Motion/Gesture Interactives Full-body engagement using depth cameras or computer vision. Visitors control content through movement—waving, stepping, dancing.
- Strengths: Highly engaging; no touch required (hygienic); naturally draws crowds; works for all ages
- Limitations: Requires space; can be noisy; needs good lighting control; accessibility considerations for mobility-impaired visitors
- Best for: High-traffic areas, family zones, dramatic reveals, physical engagement with abstract concepts
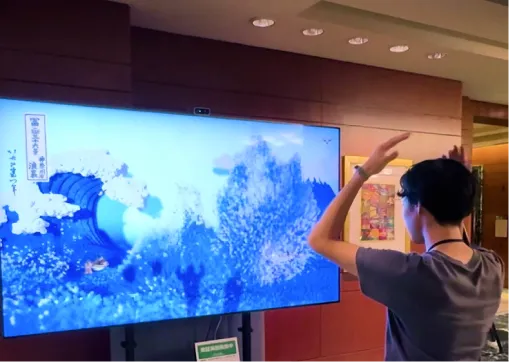
- Example: Hokusai wave installation; teamLab motion-reactive environments
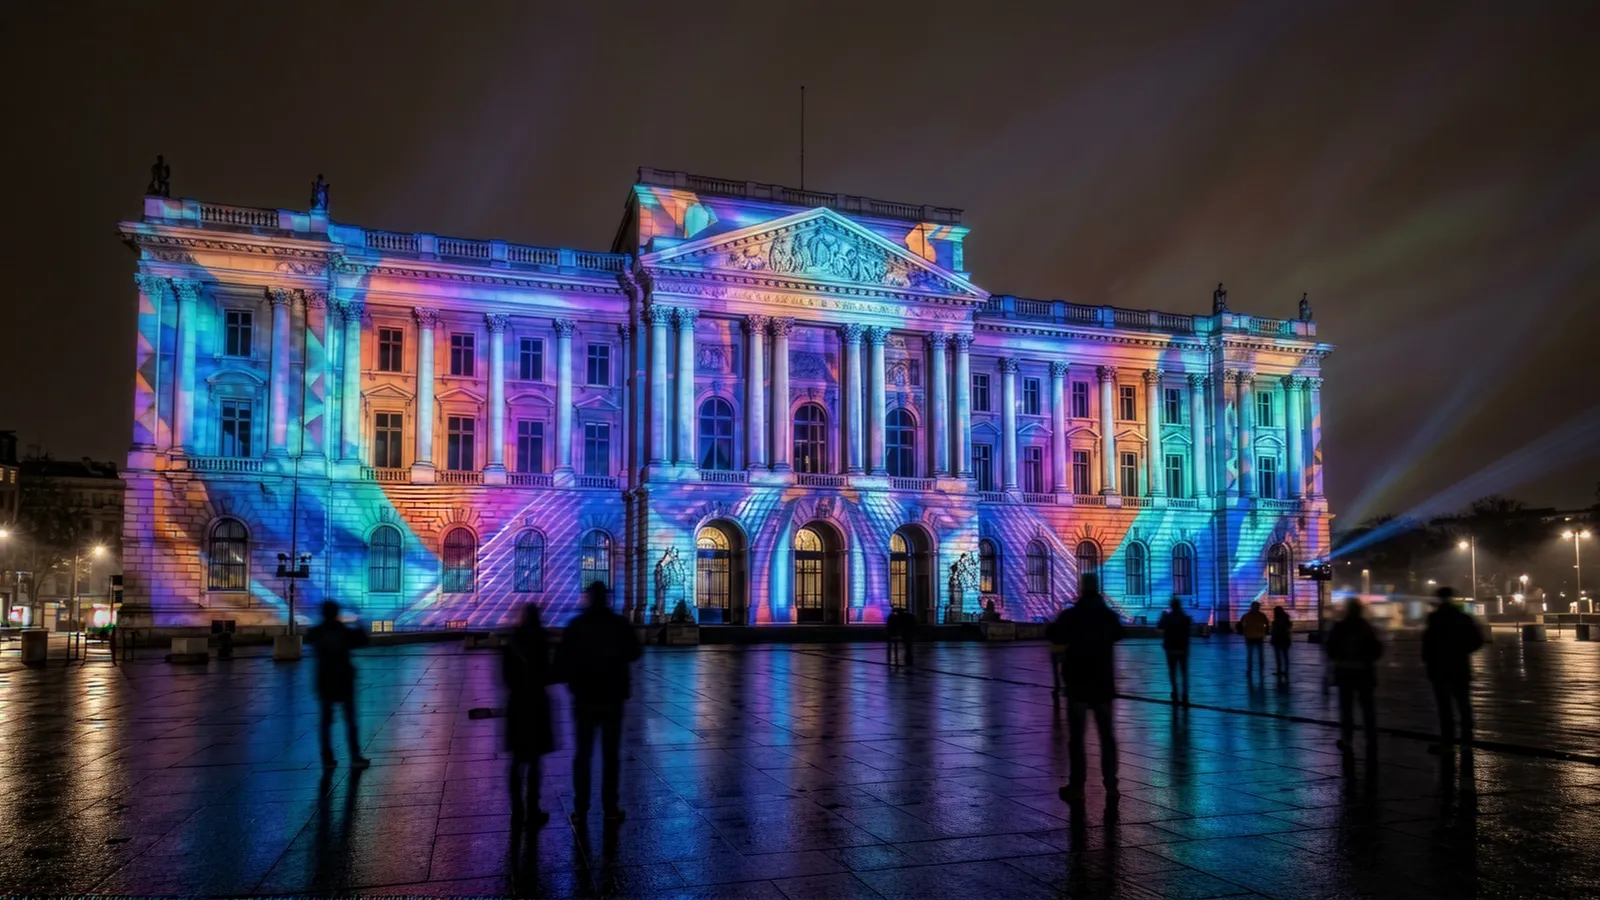
Projection Mapping Content projected onto surfaces—walls, objects, architectural features. Can be passive (atmosphere) or interactive (responding to presence or touch).
- Strengths: Transforms existing architecture; creates immersive environments; flexible scale
- Limitations: Requires lighting control; maintenance (lamp replacement, alignment); surface limitations
- Best for: Immersive rooms, object augmentation, architectural storytelling, temporary exhibitions
- Example: Immersive Van Gogh-style experiences; object projection onto artifacts
AR Layers Augmented reality via visitor devices (phones, tablets) or provided hardware (AR glasses, tablets on stands). Overlays digital content onto physical objects.
- Strengths: Reveals hidden information; enables reconstruction of damaged/missing elements; personal device means scale
- Limitations: Requires device handling; learning curve; battery/charging logistics if providing devices
- Best for: Archaeological reconstructions, behind-the-scenes views, multilingual interpretation, accessibility overlays
- Example: Museum apps showing original colors on faded artworks
Soundscapes & Spatial Audio Audio that responds to visitor position or triggers. Creates narrative layers without visual competition.
- Strengths: Non-visual engagement; works alongside objects; supports visually impaired visitors; creates atmosphere
- Limitations: Can disturb neighboring galleries; requires careful acoustic design; headphone logistics
- Best for: Oral histories, ambient atmosphere, guided narratives, accessibility
- Example: Directional speakers triggered by proximity; binaural audio tours
Maker Stations Visitors create something—drawings, digital compositions, personalized souvenirs. Output can be saved, shared, or physically produced.
- Strengths: Personal ownership; high engagement; generates shareable content; supports creativity
- Limitations: Can create queues; requires reset/cleaning between users; moderation considerations for shared displays
- Best for: Family zones, art museums, science centers, takeaway experiences
- Example: teamLab's Sketch Aquarium; digital postcard creators
Decision Matrix (quick selection tool)
| Your constraint / goal | Best-fit formats | Why it works |
|---|---|---|
| High throughput / quick cycles | Motion wall, simple projection, “one action” kiosk | Fast learning curve; short sessions |
| Deep learning / long exploration | Touch tables, kiosk deep dives | Supports layered info and reflection |
| Low language dependence | Motion/gesture, maker stations, projection | Playable through visuals and feedback |
| Low noise tolerance | Touch/tablet, quiet projection | Minimal audio required |
| Limited staff support | Durable kiosk/table, simple gesture | Lower operational overhead |
| Families + groups | Motion/gesture, multi-user touch tables | Social play = longer dwell + smiles |
| Accessibility priority | Multi-input kiosks + tactile supports | Alternative modes are easiest to provide |
Interactives can be modular so content rotates seasonally without new fabrication.
Technology Deep-Dive: What Powers Interactive Exhibits
Understanding the technology stack helps you ask better questions during vendor selection and avoid costly mismatches between ambition and infrastructure.
Software Platforms
Web-based (WebGL/WebGPU) Built on browser technology—runs on standard hardware without proprietary software. Updates deploy instantly. Our default for most projects because it reduces long-term maintenance burden and avoids vendor lock-in.
- Best for: Touch tables, kiosks, AR layers, anything needing frequent content updates
- Trade-off: Requires careful optimization for complex 3D or particle effects
Native Applications (Unity, Unreal, TouchDesigner) Higher raw performance ceiling for complex visuals or real-time physics. Common in immersive rooms and high-fidelity simulations.
- Best for: Room-scale projection, motion-reactive environments, generative art
- Trade-off: Longer update cycles, platform-specific expertise required, higher maintenance overhead
Hybrid Approaches Web front-end with native backend for sensor processing. Balances maintainability with performance.
Sensor Technologies
| Sensor Type | What It Detects | Best Use Case | Considerations |
|---|---|---|---|
| Capacitive touch | Finger contact | Touch tables, kiosks | Highly reliable; requires physical contact |
| IR touch frame | Finger/stylus position | Large displays | Works with gloves; can be triggered accidentally |
| Depth cameras (LiDAR, ToF) | Body position, gestures | Motion interactives | Lighting-independent; requires calibration |
| Standard cameras + CV | Presence, basic gestures | Crowd triggers, simple motion | Lighting-dependent; privacy considerations |
| RFID/NFC | Tagged objects, cards | Object-based storytelling | Requires physical tokens; adds tactile layer |
| Microphones | Voice commands, sound levels | Voice interfaces, reactive soundscapes | Background noise challenges; accessibility benefit |
CMS Architecture
A content management system lets curators update text, images, videos, and translations without touching code. Critical for:
- Multilingual support: Add or update language versions without developer involvement
- Seasonal content: Rotate themes for temporary exhibitions or events
- Error correction: Fix typos or outdated information immediately
- A/B testing: Compare different content approaches with real visitor data
What to ask vendors: "Can our staff update content within 24 hours of identifying a need, without scheduling developer time?"
Screens vs. Projection
| Factor | Direct-View Displays (LCD/LED) | Projection |
|---|---|---|
| Brightness | 300–1000+ nits; works in ambient light | Requires controlled lighting |
| Touch capability | Built-in or overlay options | Requires separate IR frame or depth camera |
| Form factor | Fixed rectangular; bezel constraints | Flexible shapes; projection mapping possible |
| Maintenance | Panel replacement if damaged | Lamp/laser replacement; alignment checks |
| Conservation | Heat output varies; check lux at surface | Easier to control light spill |
| Cost | Higher upfront for large sizes | More affordable for large surfaces |
Rule of thumb: Use displays for touch-primary experiences in well-lit spaces. Use projection for immersive environments, unusual surfaces, or when you need to minimize visible technology.
Hardware Selection Guide
Hardware choices affect durability, serviceability, and total cost of ownership. Here's what to consider.
Display Options
Commercial-grade LCD panels Designed for 24/7 operation with extended warranties. Higher upfront cost than consumer displays, but rated for 50,000+ hours and include features like auto-restart after power loss.
LED video walls Seamless large-scale displays without bezels. Modular tiles allow partial replacement if damaged. Higher cost per square meter, but increasingly common for signature installations.
Projection (laser vs. lamp) Laser projectors offer 20,000+ hour lifespans and consistent brightness over time. Lamp-based projectors cost less upfront but require periodic lamp replacement and gradual brightness degradation.
Touch Surfaces
| Technology | Durability | Multi-touch | Notes |
|---|---|---|---|
| PCAP (projected capacitive) | Excellent | 10–40 points | Standard for tablets/phones; works through thin glass |
| IR frame | Good | Varies | Can be added to existing displays; edge-mounted sensors |
| Surface acoustic wave | Very good | Limited | Precise; sensitive to surface contamination |
| Resistive | Fair | Single-point | Rarely used now; mentioned for legacy systems |
For museum environments: PCAP with hardened glass handles high traffic well. IR frames work better for very large surfaces or retrofits.
Computing Hardware
Embedded systems (Intel NUC, Raspberry Pi, custom ARM) Compact, fanless options for simpler interactives. Lower power consumption and heat output.
Standard PCs More processing power for complex visuals. Choose workstation-class components for reliability. Plan for adequate cooling and dust management.
Key reliability features to specify:
- Auto-start on power restoration
- Watchdog timer for automatic restart if software freezes
- Remote management capability (for monitoring and updates)
- Redundant storage (RAID or cloud backup for content)
Durability Considerations
Museum interactives face unique stresses: curious children, cleaning chemicals, power fluctuations, and years of continuous operation.
Design for serviceability:
- Use commodity components where possible (easier replacement)
- Provide tool-free access to frequently replaced parts
- Document component sources and part numbers
- Stock critical spares on-site
Environmental factors:
- Temperature and humidity ranges (HVAC consistency)
- Dust and particulate exposure
- Cleaning protocols (what chemicals are safe?)
- Power quality (surge protection, UPS for graceful shutdown)
Benefits Museums Actually See (and How to Prove Them)
Interactive installations aren't just "nice to have"—they deliver measurable improvements across engagement, learning, accessibility, and revenue. Here's what the research and practitioner experience show.
1) Engagement (dwell + participation)
Interactive experiences turn passive viewing into goal-oriented exploration. Visitors don't just look—they investigate, experiment, and return to try again.
What the research shows:
- Well-designed interactives can increase dwell time by 2–5x compared to static displays
- Family groups show the strongest engagement gains—interactives give parents and children shared activities
- "Replay behavior" (visitors returning to try again) correlates with deeper engagement and higher satisfaction scores
What drives engagement:
- Clear entry points (visitors understand how to start within seconds)
- Progressive challenge (easy to begin, rewarding to master)
- Social affordances (designed for groups, not just individuals)
- Immediate feedback (actions produce visible/audible responses)
How to measure
- Stop rate (% of passersby who engage)
- Dwell time distribution (median + tails—look for long-tail engagers)
- Completion + replay rates
- Group vs. solo usage patterns
2) Learning outcomes
Hands-on engagement improves both comprehension and retention. Interactive exhibits let visitors test hypotheses, see consequences, and build mental models through exploration.
What the research shows:
- Active manipulation improves recall compared to passive observation—the "generation effect" in learning science
- Multi-sensory engagement (visual + tactile + auditory) strengthens memory encoding
- Story-driven interactives help visitors connect objects to human contexts, improving emotional connection and recall
- Self-paced exploration allows visitors to spend time where they need it, rather than following fixed sequences
What drives learning:
- Clear learning objectives (what should visitors understand after engaging?)
- Scaffolded complexity (start simple, reveal depth)
- Immediate feedback on actions (correct/incorrect, cause/effect)
- Connection to physical objects (interactives should enhance, not replace, the real thing)
How to measure
- Task completion rates (did visitors finish the intended sequence?)
- Embedded comprehension prompts (lightweight in-experience questions)
- Pre/post "1-minute learning checks" (for formal evaluation)
- Qualitative feedback sampling (structured interviews, not anecdotal comments)
3) Accessibility and inclusion
Multiple input methods—touch, motion, voice, large-print modes, captions, audio description—make content accessible regardless of language, age, or ability. Done well, accessibility features benefit everyone, not just those who need them.
Why it matters:
- 15–20% of the population has some form of disability; accessible design expands your audience
- International visitors benefit from multilingual interfaces and low-language-dependence designs
- Older visitors appreciate adjustable text sizes, audio options, and seated interaction modes
- Families with young children need interfaces that work for multiple heights and abilities simultaneously
Accessibility as a design principle:
- Universal design improves experience for everyone (curb cuts help strollers too)
- Providing alternatives (audio + visual + tactile) creates redundancy that aids comprehension
- Clear, simple interfaces reduce cognitive load for all visitors, not just those with cognitive disabilities
How to measure
- Accessibility mode usage (track which features get used)
- Drop-off points by visitor segment (where do people give up?)
- Observational usability tests (short sessions with diverse visitor groups)
- Satisfaction surveys segmented by accessibility needs
4) Revenue lift (indirect but real)
Better experiences support business outcomes—repeat visits, memberships, sponsorships, retail, and donations. The connection isn't always direct, but it's measurable.
Revenue pathways:
- Repeat visits and memberships: Visitors who have memorable experiences return and convert to members at higher rates
- Sponsorship packages: Interactive elements offer measurable exposure (impressions, engagement time) that sponsors value
- Retail tie-ins: Interactives that create personal connections to objects can drive gift shop purchases
- Donations prompts: Asking for donations at emotional peaks (end of a powerful experience) increases conversion
What drives revenue:
- "Signature experiences" that visitors talk about and recommend
- Shareable moments that generate social media exposure
- Personal connections to collections that motivate support
- Measurable metrics that justify continued investment to boards and funders
How to measure
- QR → membership signup conversion
- Repeat visit indicators (membership scans, survey data)
- Sponsor engagement reporting (impression counts, dwell time)
- Donation prompt conversion rates
- Net Promoter Score and recommendation behavior
Costs, Timelines & Maintenance (Detailed)
Ranges vary by scope, fabrication, and content complexity. We provide fixed-price proposals after discovery.
Typical budget ranges
- Single-station interactive: ~$20K – $50K USD
- Multi-station zone / room-scale: ~$40K – $150K USD +
- Content updates (post-launch): scoped via a support plan
What drives cost (fast list)
- Number of stations + display size
- Custom fabrication vs. off-the-shelf hardware
- Sensor complexity (touch vs depth camera vs RFID)
- Content volume (languages, assets, CMS needs)
- Install constraints (rigging, after-hours, power/network)
- Support level (monitoring, SLA response time, on-site support)
Typical timeline (8–24 weeks)
- Discovery (1–3 wks): goals, audiences, collections fit
- Concept & Prototype (2–7 wks): rapid testing with visitors/staff
- Build & Fabrication (4–10 wks): software, media, hardware
- Install & Training (1–4 wks): on-site integration, handover
Maintenance & uptime
- Remote monitoring & alerts
- Swappable modules & spares list
- CMS for text/media/language updates
- SLA options (response times, on-site support)
Procurement & RFP Process
How you structure vendor selection affects both the quality of proposals you receive and your ability to compare them fairly.
Writing an Effective RFP
For a step-by-step template, see our studio briefing guide.
Include these elements:
- Project context: Institution type, target audiences, gallery constraints, and strategic goals
- Scope definition: Number of stations, content volume, languages, integration requirements
- Technical requirements: Power/network infrastructure, accessibility standards, conservation constraints
- Timeline: Key milestones, hard deadlines (exhibition opening, funding cycles)
- Budget range: Even a broad range helps vendors propose appropriate solutions
- Evaluation criteria: Weight factors (creative vision, technical approach, relevant experience, price)
- Submission requirements: What you need to evaluate (concepts, references, team bios, pricing breakdown)
Common RFP mistakes:
- Being too vague about goals (you'll get generic proposals)
- Being too prescriptive about solutions (you'll miss better approaches)
- Unrealistic timelines (quality vendors may not bid)
- No budget indication (proposals will vary wildly in scope)
What to Ask Vendors
Technical capability:
- "Walk me through a similar project you've delivered."
- "How do you handle updates and bug fixes post-launch?"
- "What happens if a key team member leaves mid-project?"
Process and collaboration:
- "How do you involve our staff in prototyping and testing?"
- "What decisions will you need from us, and when?"
- "How do you handle scope changes?"
Support and maintenance:
- "What's included in your warranty period?"
- "What are your response times for critical issues?"
- "Can we update content ourselves, or do we need you?"
Red Flags in Proposals
Watch for these warning signs:
- No questions asked: Good vendors probe requirements before proposing
- One-size-fits-all pricing: Detailed breakdowns indicate thoughtful scoping
- Vague timelines: "4–8 weeks" without milestones suggests inexperience
- No maintenance plan: Installation without support is a recipe for problems
- Overselling technology: Focus on visitor outcomes, not tech specs
- No references: Ask for contacts at similar institutions
Evaluation Framework
| Criterion | Weight | What to Assess |
|---|---|---|
| Creative vision | 25% | Does the concept serve your interpretive goals? |
| Technical approach | 25% | Is the technology appropriate and maintainable? |
| Relevant experience | 20% | Have they delivered similar projects successfully? |
| Team and process | 15% | Will collaboration be smooth? |
| Price | 15% | Is the budget realistic for the proposed scope? |
Adjust weights based on your priorities. For institutions new to interactives, weight experience and process higher.
Stakeholder Checklist (So This Doesn't Stall Internally)
Involve early:
- Curatorial: story integrity, interpretive approach, object context
- Education: learning goals, age ranges, classroom alignment
- Visitor experience: flow, queueing, signage, accessibility
- Conservation: light/heat/sound/vibration constraints, materials
- Facilities/IT: power, network, mounting, safety
- Security: crowd behavior, equipment protection
- Comms/Marketing: share moments, photography policy, sponsor needs
Accessibility & Conservation Safety
Accessibility isn't an add-on—it's a design requirement. And in museum environments, conservation constraints add another layer of complexity. Here's how to address both.
Accessibility Standards
WCAG 2.1 for Digital Interfaces Web Content Accessibility Guidelines apply to interactive kiosks and touch interfaces. Key requirements:
| Level | Requirement | Museum Application |
|---|---|---|
| A | Text alternatives for non-text content | Alt text for all images; audio descriptions for video |
| A | Keyboard accessible | All functions reachable without touch (for switch users) |
| A | Seizure safety | No content flashing more than 3 times per second |
| AA | Color contrast 4.5:1 minimum | Check all text against backgrounds |
| AA | Resize text up to 200% | UI must remain usable when enlarged |
| AA | Captions for all audio | Live captions for video content |
| AAA | Sign language interpretation | Consider for key content |
ADA Physical Requirements Americans with Disabilities Act requirements for physical installations:
- Reach ranges: Forward reach 15"–48" from floor; side reach 15"–46"
- Clear floor space: Minimum 30" × 48" for wheelchair approach
- Controls: Operable with one hand, without tight grasp or twisting
- Protruding objects: Nothing projecting more than 4" into circulation paths above 27" from floor
Cognitive Accessibility Often overlooked but critical for broad usability:
- Plain language: Reading level appropriate for general audience (aim for 8th grade or below)
- Consistent navigation: Same patterns throughout the experience
- Error prevention: Confirm destructive actions; provide undo
- Time limits: Allow users to extend or disable time limits
- Predictable behavior: Consistent responses to same actions
Physical Access Design
Reach and approach:
- Multiple interaction heights (standing, seated, child)
- Clear floor area for wheelchair users
- Adequate lighting for lip-reading and sign language visibility
Sensory alternatives:
- Captions for all spoken/video content
- Audio description for visual elements
- Tactile models or haptic feedback where appropriate
- Visual indicators for audio cues
Language access:
- Multilingual UI (prioritize based on your visitor demographics)
- Plain-language modes for complex content
- Icon-based navigation to reduce language dependence
Conservation Constraints
Interactive installations near sensitive objects require careful environmental control.
Light discipline:
- Maximum lux levels vary by material (50 lux for textiles, 200 lux for oil paintings—consult your conservator)
- UV filtering for any light source
- Heat output from displays must not affect nearby objects
- Consider timed dimming or proximity-triggered lighting
Sound discipline:
- Directional speakers to contain audio
- Volume limits appropriate for neighboring galleries
- Consider headphone options for sensitive spaces
Vibration and physical impact:
- Isolate interactive elements from cases containing objects
- Floor-mounted installations need vibration damping
- Touch interactions should not transmit force to nearby displays
Environmental monitoring:
- Temperature and humidity stability (interactive hardware generates heat)
- Air quality considerations (off-gassing from new electronics)
- Dust generation from visitor traffic
Accessibility Testing Checklist
Before launch, verify:
- All content readable with screen reader
- All functions accessible via keyboard/switch
- Color contrast meets WCAG AA (4.5:1 for text)
- Captions provided for all audio/video
- Controls reachable from wheelchair
- Clear floor space maintained
- Plain language used throughout
- Error messages helpful and recoverable
Staff Training & Handover
Even the best-designed interactive fails if front-line staff can't support it. Training and documentation are as important as the technology itself.
What Staff Need to Know
Daily operations:
- How to start up and shut down the system
- What "normal" looks like (so they recognize problems)
- Basic troubleshooting: restart procedures, clearing stuck screens
- Who to contact when something goes wrong
Visitor support:
- How to explain the interaction to confused visitors
- Accessibility features and how to enable them
- Common questions and good answers
Content and updates:
- How to use the CMS (if applicable)
- What changes require developer support vs. staff-manageable
Daily Checks Checklist
Train floor staff to verify these items each opening:
- All displays powered on and showing correct content
- Touch/sensors responding to input
- Audio playing at appropriate levels
- No error messages or frozen screens
- Physical components clean and undamaged
- Accessibility features functional
Time required: 5–10 minutes per station once staff are trained.
Troubleshooting Basics
| Symptom | First Response | If That Fails |
|---|---|---|
| Screen frozen | Wait 30 seconds; try touch input | Power cycle the display |
| No touch response | Check for obstructions; clean surface | Restart the computer |
| No audio | Check volume settings; verify cables | Contact support |
| Error message displayed | Note the exact message | Contact support with details |
| Sensor not responding | Check for obstructions; verify lighting | Power cycle the sensor |
Escalation Paths
Document clearly:
- On-site contact: Who handles first-level issues during operating hours
- Remote support: How to reach the vendor for technical issues
- Emergency procedures: What to do if the installation poses a safety risk
- Response time expectations: What's covered under warranty/SLA
Documentation Deliverables
Request these from your vendor at handover:
- Operations manual: Daily procedures, troubleshooting, contact information
- Technical documentation: System architecture, component specifications, network requirements
- CMS guide: Step-by-step instructions for content updates
- Spares list: What to keep on-site, where to order replacements
- Training recording: Video walkthrough for onboarding new staff
Examples & Use Cases
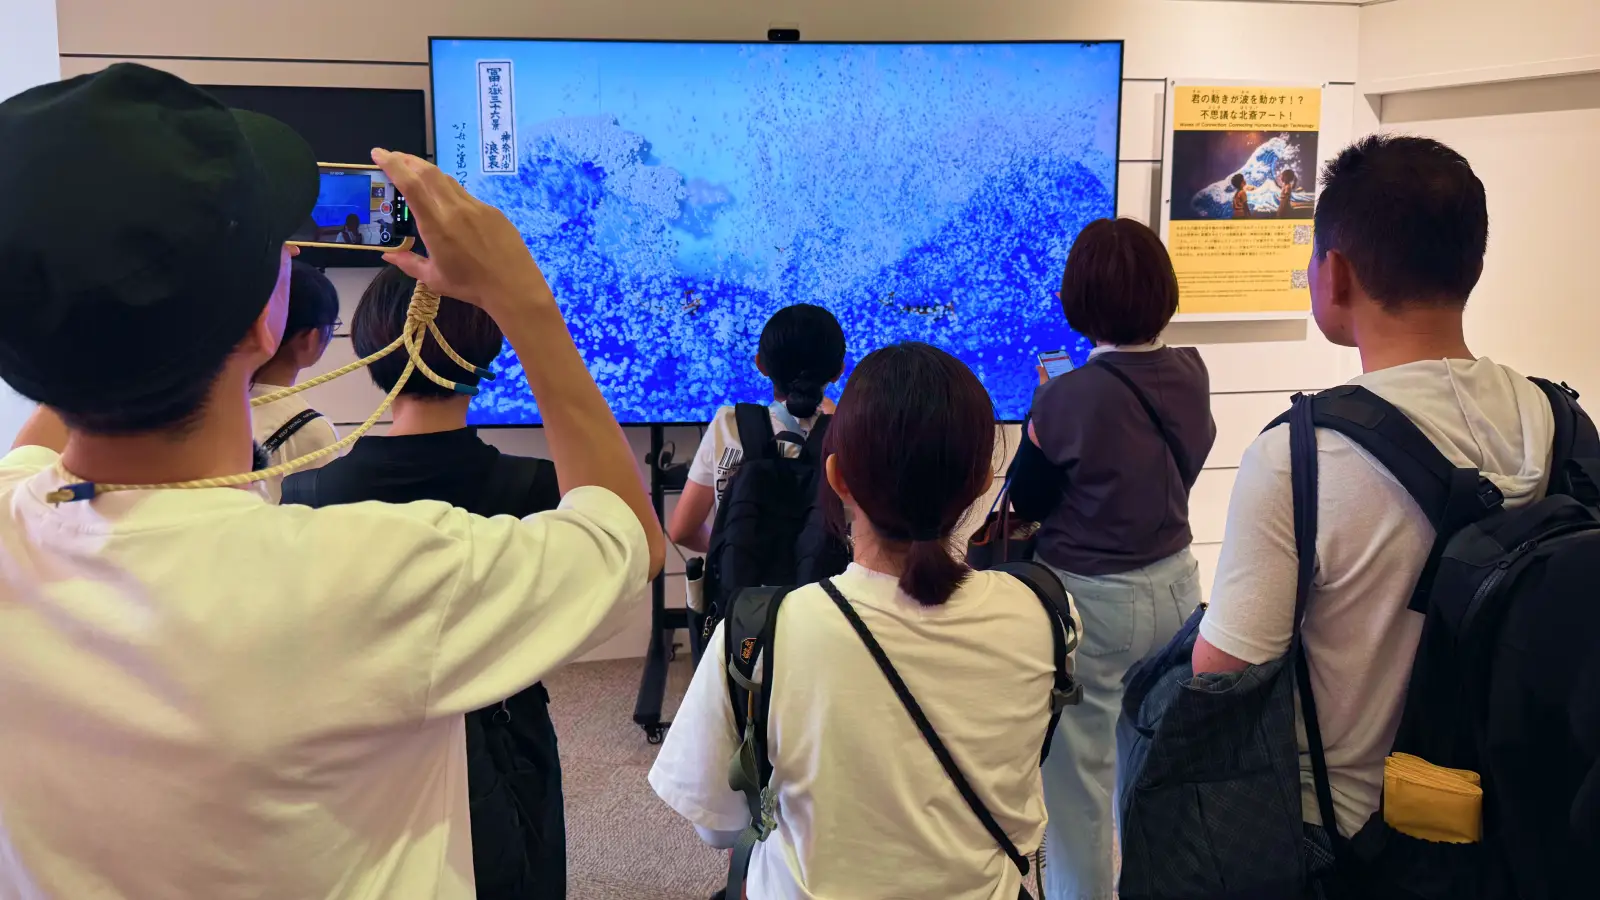
Hokusai "Great Wave" Interactive
Art meets play. Visitors "steer" the wave with body movement, turning an iconic print into a living canvas. Read the full case study.
- Interaction: Full-body motion control; real-time wave physics
- Why it works: Simple to learn, satisfying to master, instantly photogenic
- Audience: All ages; accessible alternatives for non-ambulant visitors
- Operational note: Design for clear "start zone" + quick reset to manage throughput
- Impact signals: Strong dwell and repeat attempts; high filming behavior Credit: Utsubo.
Inspired by The Great Wave off Kanagawa by Katsushika Hokusai.
“Sketch Aquarium”
Creation becomes play. Visitors draw sea creatures; scanned drawings appear in a projected aquarium and swim in real time.
- Interaction: Scan-and-project pipeline; real-time animation; touch/proximity reactions
- Why it works: Ultra-low learning curve, personal ownership of outcomes, highly photogenic
- Audience: Families, school groups, all ages; minimal language dependence
- Operational note: Queue design matters—this format can attract crowds
- Impact signals: High replay rate + “find mine” behavior
Credit: teamLab.

Cleveland Museum of Art “ArtLens Exhibition” Touch Tables
Browse becomes performance. Multi-user touch tables let visitors explore artworks with smooth motion design and subtle physics.
- Interaction: Large-format multi-touch; multi-user browsing; “cards” that expand with micro-interactions
- Why it works: Immediate feedback + strong motion language makes browsing feel alive
- Audience: Teens to adults; groups gather and co-browse
- Operational note: Durable surfaces + simple cleaning plan are key
- Impact signals: Long dwell + strong perceived quality of the gallery UI
Credit: Cleveland Museum of Art (ArtLens Exhibition).
Analytics & AI (Privacy-First)
When integrated ethically and transparently, analytics and AI can improve planning, accessibility, and iteration—without compromising visitor privacy.
What we can measure (without identifying people)
- Visitor flow patterns (counts and directionality)
- Dwell time and engagement hotspots
- Interaction events (starts, completions, drop-offs)
- Time-of-day and crowd-level performance
What we avoid by default
- No facial recognition
- No identity tracking
- No storing personal data or photos unless explicitly designed as an opt-in “takeaway”
How we keep it trustworthy
- Data minimization: only what’s needed for decisions
- Transparency: clear on-site signage if analytics is used
- Exports: dashboards + CSVs for grant reporting and board updates
Common Pitfalls (and How to Avoid Them)
People don't understand how to start
- ✅ Use an idle screen that demonstrates the first action in 3–5 seconds
The experience is fun but disconnected from the collection
- ✅ Tie interaction outcomes directly to objects, themes, or interpretive goals
Queue chaos / blocking circulation
- ✅ Design for throughput: short cycles, clear start zones, and "watching teaches playing"
No plan to maintain
- ✅ Include daily checks + remote monitoring + spares strategy
Tech breaks and no one notices
- ✅ Implement remote monitoring with alerts; train staff to report issues; include "health check" in daily opening procedures
- A broken interactive that sits dark for days damages visitor trust and wastes your investment
Accessibility treated as an afterthought
- ✅ Include accessibility requirements in initial RFP; test with diverse users during prototyping; budget for alternatives
- Retrofitting accessibility is expensive and often results in compromised solutions
Content gets stale and outdated
- ✅ Build in CMS capability from the start; schedule quarterly content reviews; budget for refresh cycles
- Even the best interactive loses impact when content feels dated or references become obsolete
Experience doesn't scale for busy days
- ✅ Design for peak capacity, not average; provide parallel engagement options; create "watching is learning" affordances
- An interactive that works for 10 visitors but fails for 100 becomes a frustration point during high-traffic events
Post-Launch Optimization
Launch is the beginning, not the end. The best museum interactives improve over time based on real visitor behavior.
Using Analytics to Iterate
What the data tells you:
- High drop-off at specific point: Confusing instruction or too-difficult task
- Short average dwell, few completions: Not engaging enough; consider simplifying
- Long dwell but low replay: Engaging but lacks replayability; consider variations
- Accessibility mode rarely used: Feature may be hard to find; improve discoverability
- Crowding at certain times: May need queue management or parallel stations
Review cadence: Monthly for the first quarter, then quarterly. More frequently during special exhibitions or after content changes.
A/B Testing Content
When the CMS supports it, test variations:
- Instruction text: Which phrasing gets more completions?
- Difficulty levels: Does easier/harder affect dwell time?
- Visual treatments: Which imagery draws more attention?
- Call-to-action placement: Where do QR codes get more scans?
Important: Test one variable at a time. Run tests long enough to account for visitor mix variations (weekdays vs. weekends, school groups vs. general public).
Seasonal Refreshes
Keep the installation feeling fresh without rebuilding:
- Content rotation: Swap featured objects, stories, or challenges
- Themed overlays: Holiday or exhibition tie-ins
- Difficulty adjustments: Harder modes for repeat visitors
- New languages: Expand accessibility as visitor demographics shift
Planning tip: Budget for 2–4 content updates per year in your initial contract. It's cheaper than retrofitting update capability later.
Extending Installation Lifespan
Interactive exhibits typically have a 5–10 year expected lifespan. Maximize your investment:
Technology refresh points:
- Year 2–3: Software updates, new content modules
- Year 4–5: Hardware refresh if needed (displays, computers)
- Year 6+: Major redesign or replacement planning
Signs it's time to refresh:
- Visitor engagement metrics declining
- Hardware failures becoming frequent
- Content feeling dated
- Better technology available at similar cost
- Exhibition context has changed
End-of-life planning: Document lessons learned for future projects. Archive content and code for potential reuse. Plan decommissioning to avoid orphaned systems.
Our Process
- Discovery & Audience Goals — align on story, learning targets, and success metrics
- Concept & Rapid Prototype — test early with staff and visitors
- Accessibility & Usability Pass — multiple input modes, reach ranges, captions
- Build & Fabrication — robust hardware, durable finishes, serviceability
- Install & Staff Training — smooth handover, documentation, spares
- Support & Analytics — monitor, maintain, and evolve content
FAQs
How much do interactive museum installations cost? Budget ranges typically start around $20K for a single-station interactive and scale with custom hardware, content complexity, and fabrication. For a detailed breakdown, see our interactive installation cost guide. We provide fixed-price proposals after discovery. For guidance on choosing the right studio partner, see our selection guide.
How long does it take?
Most projects run 8–24 weeks from discovery to installation, depending on scope, approvals, and testing.
Are interactives accessible?
Yes. We design for varied mobility, vision, hearing, and cognitive needs—tactile supports, captions, audio description, adjustable reach ranges, and accessible routes.
Will the tech damage artifacts?
We design for conservation safety: controlled illuminance, low heat, vibration isolation, and appropriate mounting distances.
Can curators update content without developers?
Yes. A CMS lets staff change text, media, and languages; updates deploy without touching hardware.
Plan an Interactive Exhibit
Get a free 30-minute planning call with our exhibition team. We’ll review your goals, audiences, budgets, and timeline, and outline a right-sized approach.
 Interactive Installations for Museums