The global brand activation market is worth $86.66 billion and growing at 5.28% annually. But most of that spend still goes to passive displays and signage that get scrolled past—or walked past—in seconds.
Interactive installations change that equation. When designed for temporary environments—pop-ups, trade shows, product launches, seasonal activations—they create the crowd-forming, UGC-generating, lead-capturing moments that justify experiential budgets with measurable outcomes.
This guide covers what works for temporary installations: the formats, the design principles, the budget tiers, and the logistics that separate a viral activation from an expensive failure.
Who this is for: Brand marketers, event managers, and retail marketing directors planning temporary interactive experiences for pop-ups, trade shows, product launches, or seasonal activations.
Key Takeaways
- Temporary installations have unique constraints: setup speed, venue limitations, portability, and shorter training windows—design for these from the start.
- The "5-second rule" matters even more at events: if people can't understand how to play immediately, they'll move to the next booth.
- Modular design turns a single build into multi-event ROI—plan reuse from day one.
- Budget tiers range from $30K (single-screen activation) to $150K+ (immersive room-scale experience or multi-event tour).
- Define success metrics before you build: dwell time, lead capture, UGC rate, post-event attribution.
1. Why Pop-ups & Events Need More Than Video Content
1-1. The Attention Gap at Temporary Activations
Event environments are saturated:
- Every booth has screens
- Every pop-up has video content
- Every brand is competing for the same eyeballs, at the same time, in the same space
Video alone becomes wallpaper—seen, not remembered. The average trade show attendee visits 26 booths and remembers 6. The average mall visitor walks past dozens of brand activations.
1-2. From "Content to Watch" to "Experience to Join"
Interactive installations shift the dynamic:
- People stop because something responded to their presence
- Crowds form because watching others play is entertaining
- Photos happen because the output is designed for sharing
- Data flows because engagement is trackable
When the experience economy meets event marketing, passive becomes participatory—and participation converts.
2. What Makes Interactive Installations Work for Temporary Events?
2-1. Common Formats for Pop-ups and Events
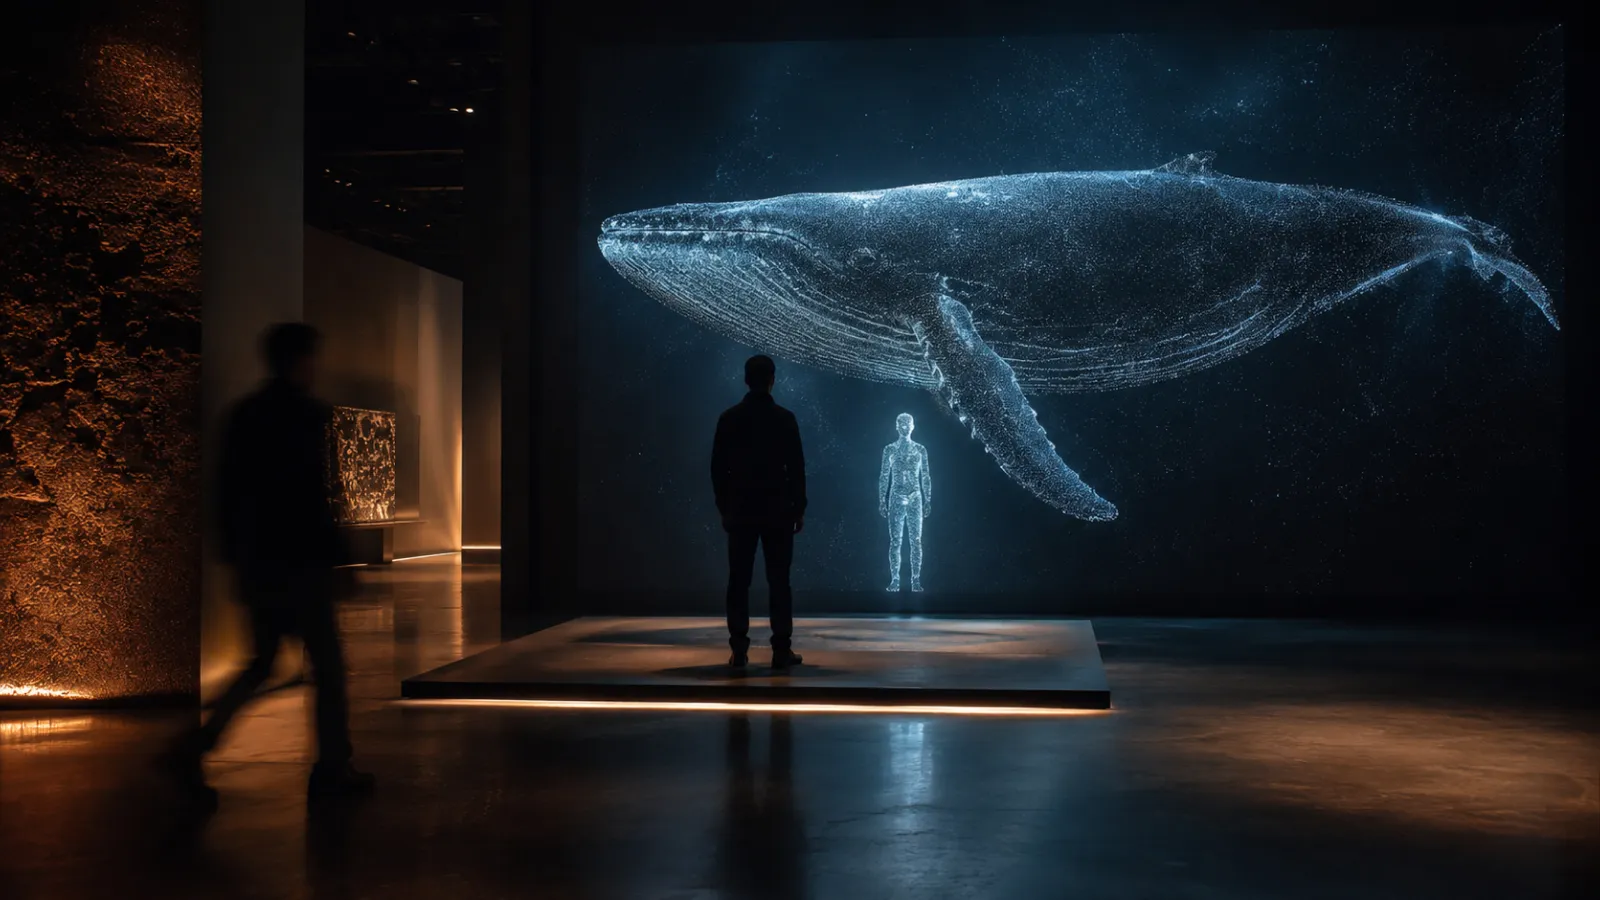
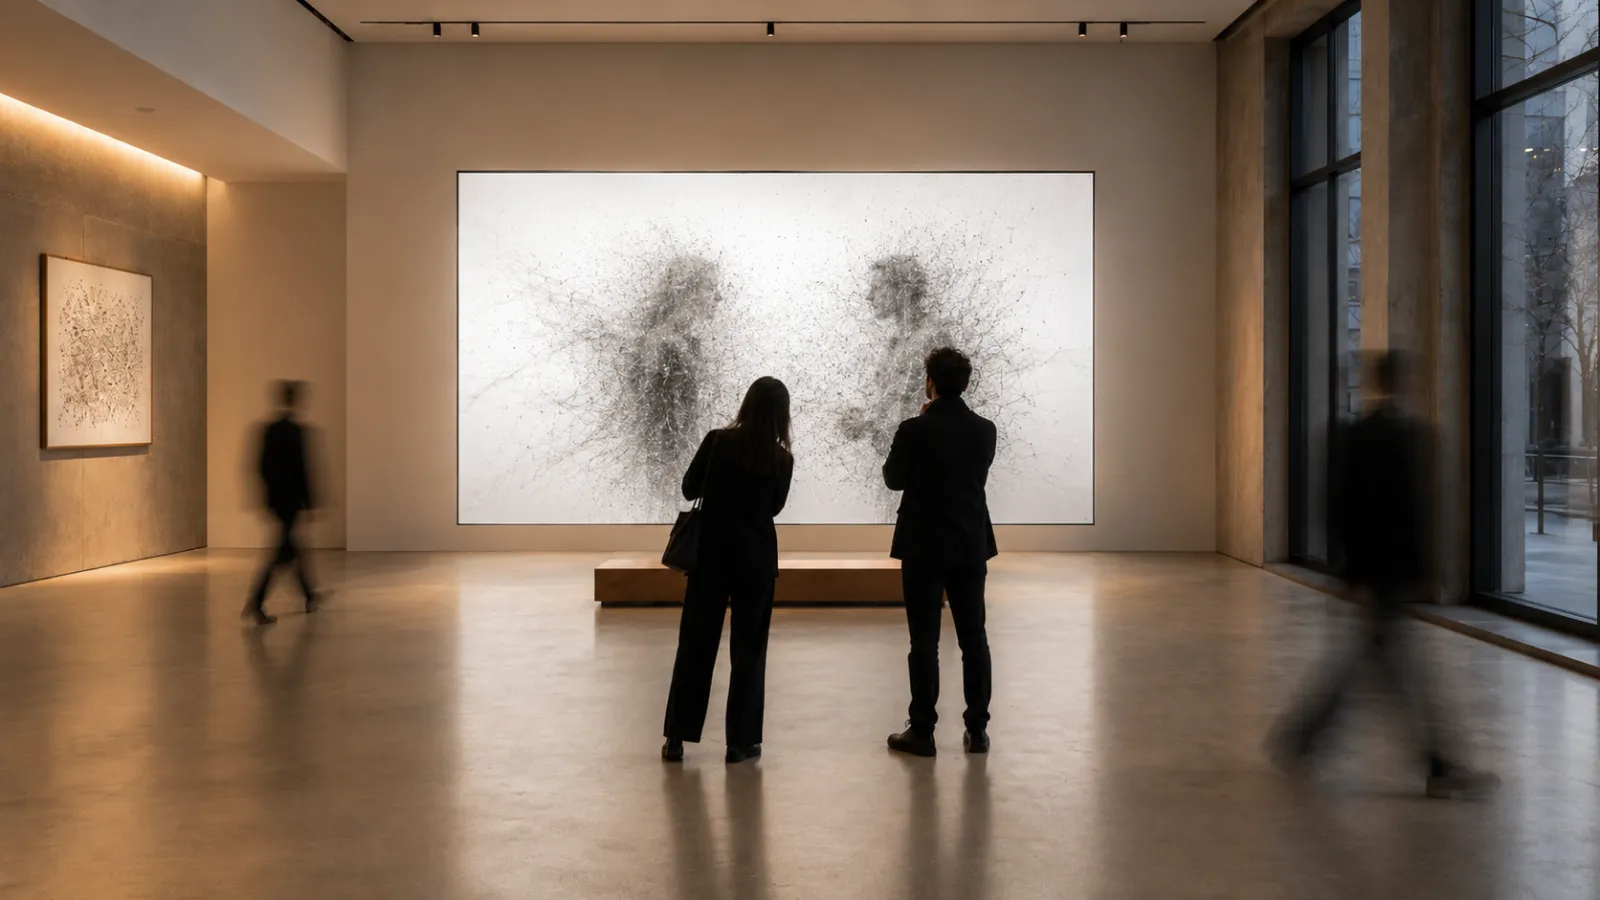
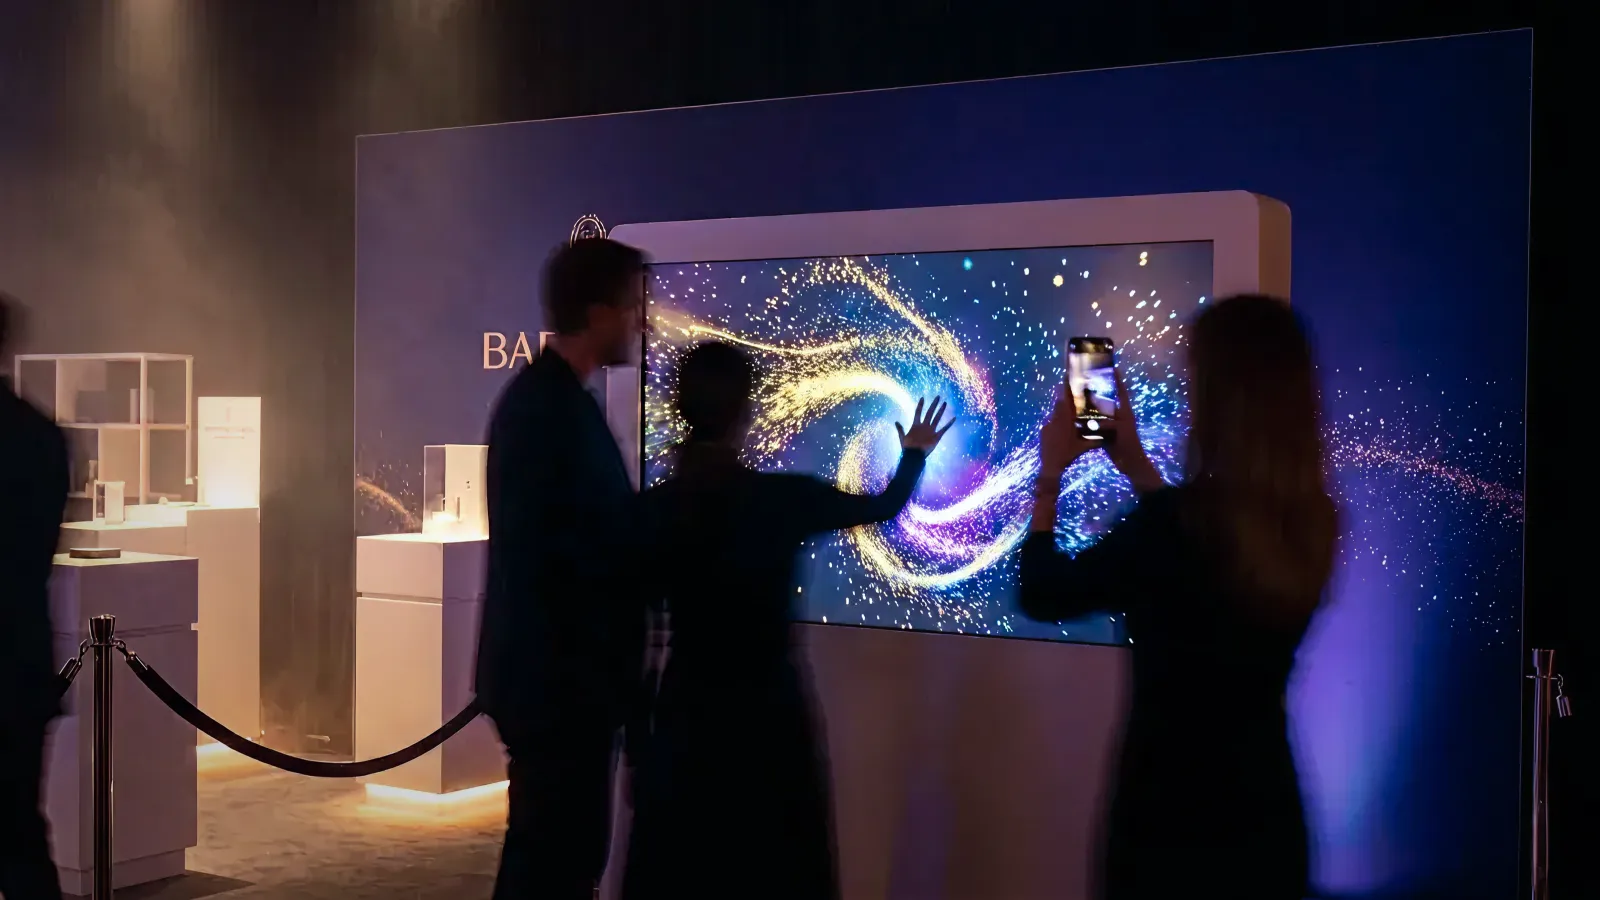
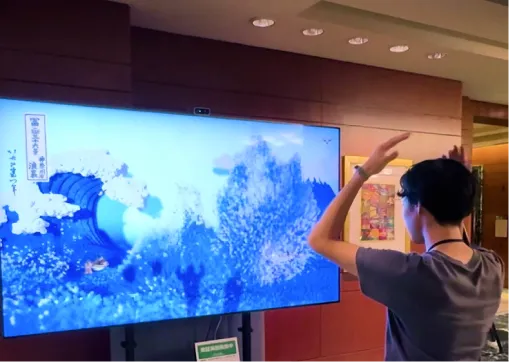
Motion/Gesture Walls Full-body reactive displays. Stand in front → your silhouette triggers effects. Great for crowd formation and photo moments. Works well at trade show entrances and pop-up storefronts.
Touch Displays and Multi-User Tables Multiple people can interact simultaneously. Ideal for product exploration, configurators, and guided brand narratives. Common at product launches and showroom events.
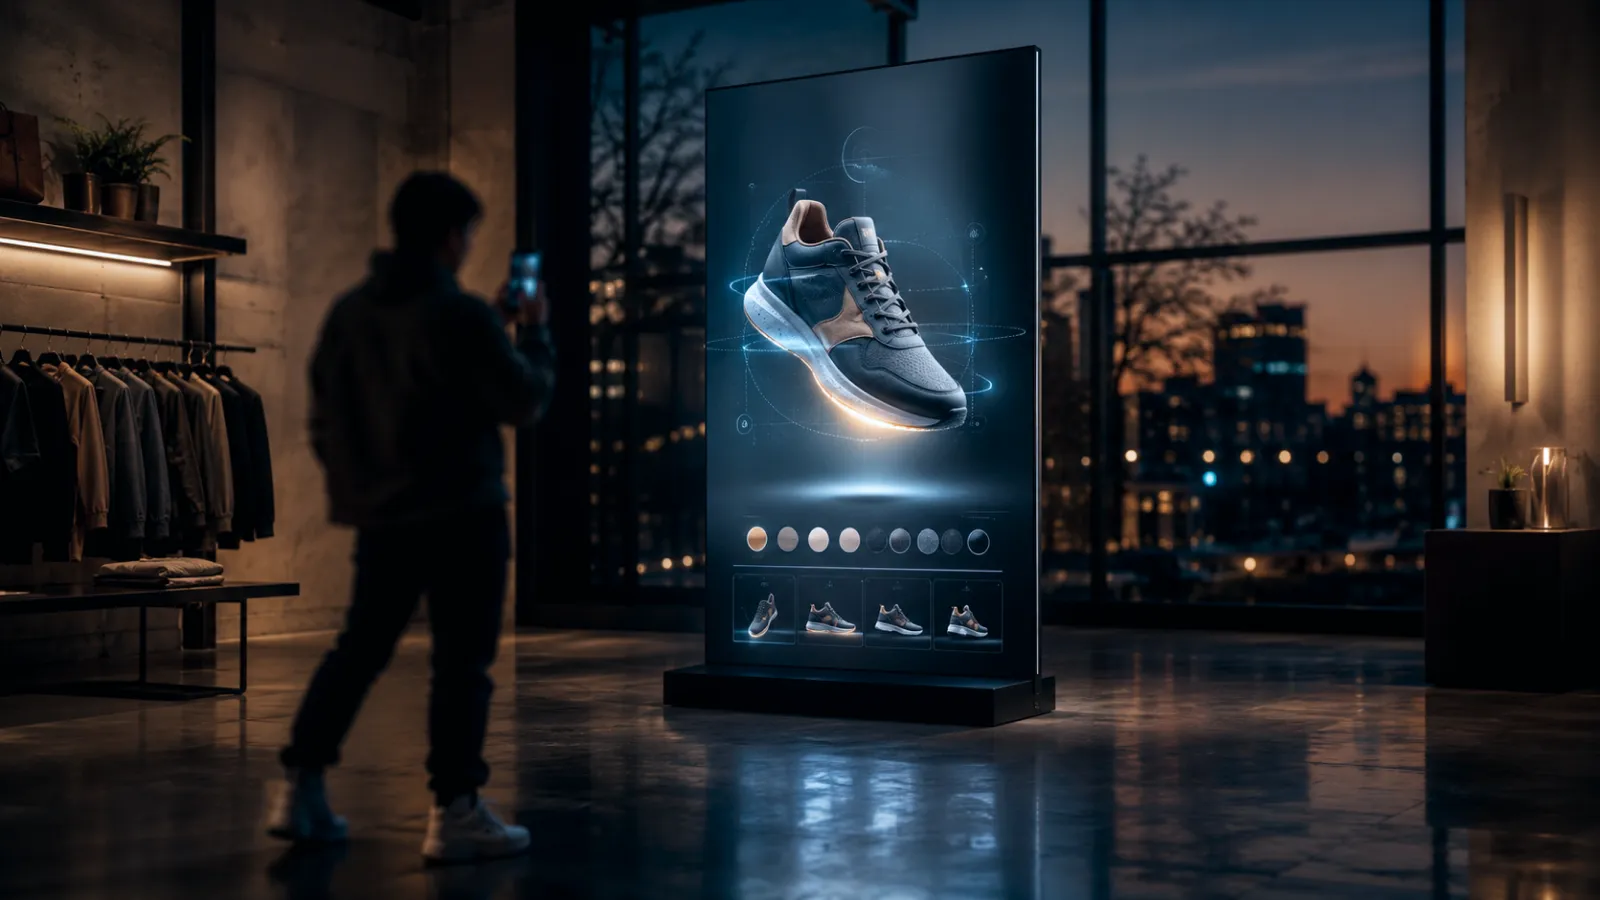
Product-Triggered Experiences (RFID/NFC/QR) Pick up a product → content appears on screen. Bridges physical merchandise with digital storytelling. Powerful for retail pop-ups and brand activations.
AR Photo Moments and Branded Filters Visitors "step into" brand worlds for shareable photos or short videos. Low hardware footprint, high UGC potential. Works everywhere from mall activations to festival brand tents.
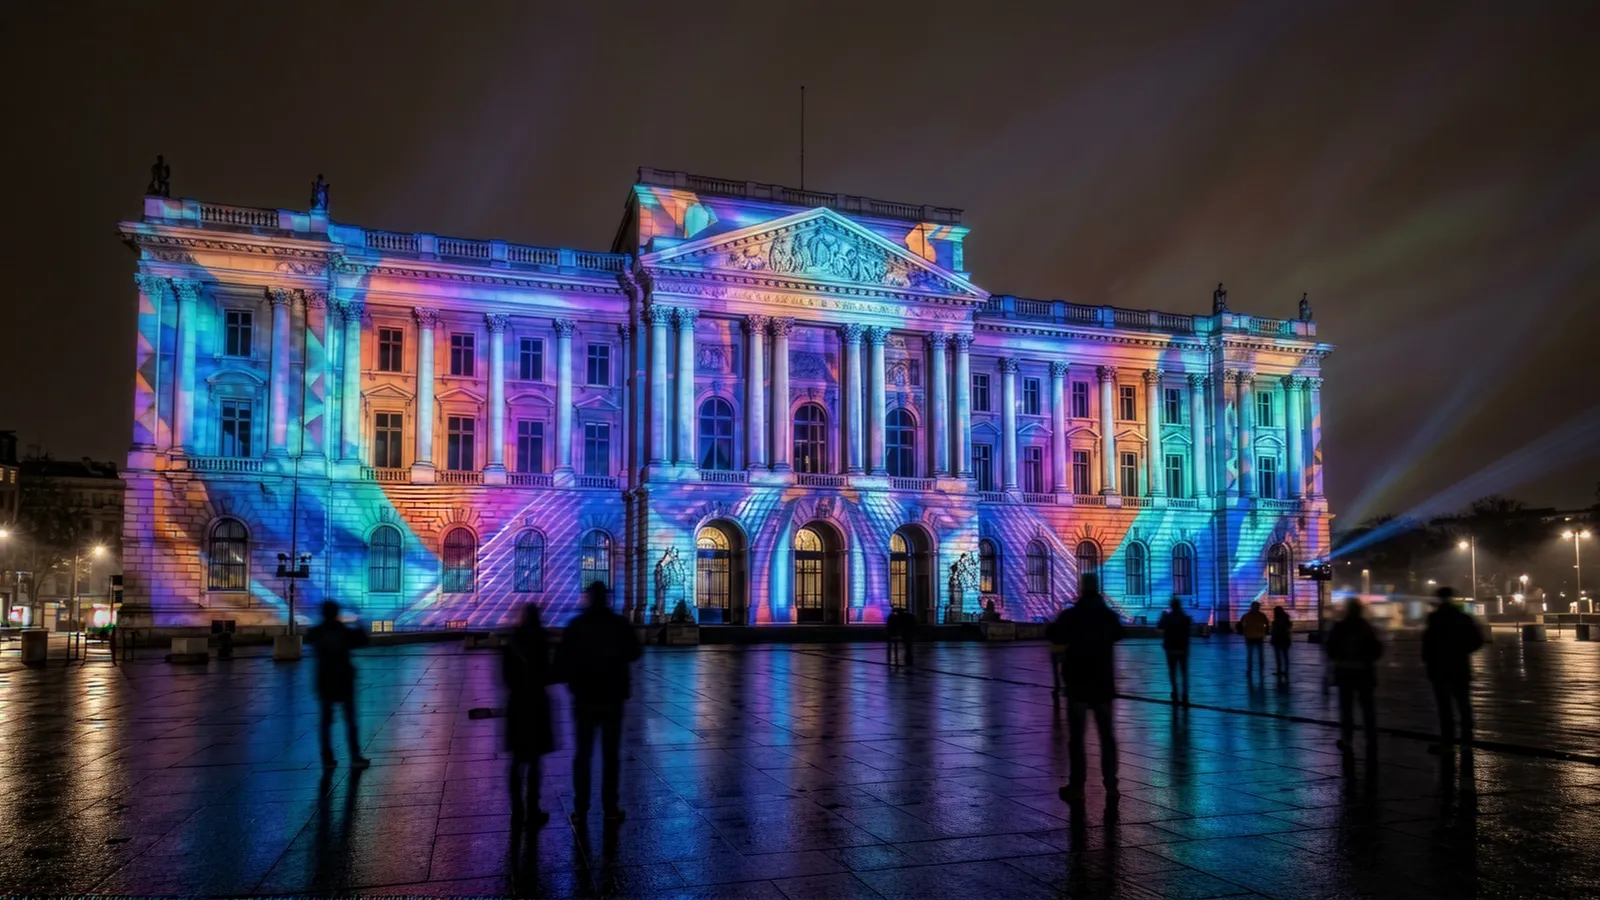
Projection Mapping and Spatial Media Transform entire spaces—walls, floors, objects—into reactive environments. High impact but requires controlled lighting and venue coordination.
2-2. The Unique Challenges of Temporary Installations
Unlike permanent retail or museum installations, event work comes with specific constraints:
| Challenge | Permanent Installation | Event Installation |
|---|---|---|
| Setup time | Days to weeks | Hours to 1-2 days |
| Venue control | Full | Limited (shared power, regulations) |
| Staff training | Dedicated, ongoing | Brief, often new staff each event |
| Reliability window | Months/years | 1 day to 4 weeks |
| Teardown | Rare | Required, often overnight |
Designing for events means designing for these constraints from day one—not adapting a permanent solution at the last minute.
3. The 4 Outcomes Interactive Event Installations Deliver
3-1. Stop Power & Crowd Formation
At events, the first job is to change behavior. When one person stops to interact:
- Others gather to watch
- That crowd attracts more people
- Phones come out
- Staff can engage the group
A well-designed installation becomes a self-reinforcing attention loop.
3-2. Brand Story Becomes Personal
Video is a "watching" medium. Interactive is a "participating" medium.
When the experience reacts to the visitor:
- It feels like their moment, not a generic campaign
- The brand becomes a story they can retell
- Memory formation is stronger (active participation vs. passive viewing)
3-3. Built-in UGC & Social Amplification
The best event installations include a designed "share peak":
- The climax is naturally photogenic
- The result looks like a branded asset
- Sharing is frictionless (QR download, branded frame, short clip output)
That's how you generate organic reach without buying more media—amplifying event investment through attendee networks.
3-4. Data Capture & Lead Generation
Event installations can integrate lead capture directly:
- Email collection for digital outputs
- QR codes linking to landing pages
- CRM integration for follow-up campaigns
When someone wants to receive their photo or result, permission-based data capture becomes natural, not intrusive.
4. Designing for Event Audiences: Key Principles
4-1. The 5-Second Rule: Immediate Comprehension
Event attendees are moving fast and evaluating constantly. Your installation must be playable without instruction:
- One obvious first action ("Stand here" / "Touch to start")
- Immediate visual feedback
- The idle screen demonstrates the interaction (watch → learn → try)
If it takes longer than 5 seconds to understand, people move on.
4-2. Solo and Group Play Modes
Design for both contexts:
- Solo: Quick weekday trade show visit, "try it once" curiosity
- Groups: Friends at a festival, colleagues at a conference, families at a mall activation
Group modes increase dwell time, filming behavior, and repeat attempts ("Your turn next!").
4-3. Multi-language, Multi-cultural Accessibility
Event audiences are often diverse. Reduce language dependence:
- Prioritize icons, animation, and visual feedback over text
- Keep any text minimal, big type, high contrast
- Consider audio-free or ambient audio (event spaces are loud)
See our retail interactive installation guide for deeper guidance on designing for mixed audiences.
4-4. The "Takeaway Output" That Gets Shared
Strong outputs include:
- A branded photo or short clip
- A digital card (character, result, style, "your version")
- A QR code for instant download
- A social frame + suggested hashtag
The takeaway is what converts an in-person moment into an online amplifier.
4-5. Connecting Physical to Digital (QR, CRM, Follow-up)
Event ROI extends beyond the event itself:
- QR codes on outputs link to landing pages
- Email collection enables post-event nurture campaigns
- CRM integration tracks conversion from engagement to action
Plan the digital journey before the physical build.
5. Event-Specific Design Considerations
5-1. Trade Shows & Conferences
- Goal: Qualified lead capture, competitive differentiation
- Environment: High noise, limited floor space, strict setup windows
- Design focus: Fast comprehension, easy handoff to sales staff, lead capture integration
- Common formats: Touch displays with product configurators, gesture walls at booth entrance, AR photo moments
5-2. Product Launch Pop-ups
- Goal: Media attention, social amplification, hands-on product experience
- Environment: Controlled brand space, often influencer/press previews
- Design focus: Photogenic moments, narrative flow, product storytelling
- Common formats: Spatial projection, product-triggered displays, immersive photo booths
5-3. Seasonal & Holiday Activations
- Goal: Foot traffic, brand association with celebration, family engagement
- Environment: Mall common areas, department store floors, outdoor spaces
- Design focus: Multi-generational appeal, festive theming, high throughput
- Common formats: Large-scale gesture walls, holiday-themed photo outputs, collectible digital cards
5-4. Festival & Outdoor Events
- Goal: Brand presence, social buzz, sampling integration
- Environment: Variable lighting, weather exposure, power constraints
- Design focus: Rugged hardware, high-contrast visuals, offline capability
- Common formats: AR experiences, self-contained photo booths, mobile-integrated games
6. Budgeting for Temporary Interactive Installations
6-1. Cost Categories
| Category | Description | Typical % |
|---|---|---|
| Concept & Design | Creative development, UX/interaction design, visual design | 15-20% |
| Software Development | Custom application, content integration, analytics | 25-35% |
| Hardware | Displays, sensors, compute, custom fabrication | 20-35% |
| Installation & Operations | Setup, teardown, on-site support, staff training | 10-20% |
| Contingency | Buffer for venue surprises, last-minute changes | 5-10% |
6-2. Budget Tiers: $30K / $75K / $150K+ Examples
Starter Tier: $30,000–$50,000
- Single large screen (55-75") with motion-reactive visuals
- Basic gesture interaction (stand → trigger)
- Branded photo output via QR
- Basic analytics (engagement counts)
- 1-week activation
Mid-Tier: $75,000–$120,000
- Multi-screen or projection installation
- More complex interaction (multi-user, product triggers)
- Full branded photo/video output with sharing
- Lead capture + CRM integration
- Analytics dashboard
- 2-4 week pop-up or trade show tour (2-3 events)
Premium Tier: $150,000–$250,000+
- Room-scale immersive experience
- Custom hardware/fabrication
- Modular design for easy reuse and reconfiguration
- Advanced analytics and post-event attribution
- Full production support (setup, training, on-site technician)
- Multi-event tour capability (5+ events)
6-3. Rental vs. Purchase: When Each Makes Sense
Rental makes sense when:
- Testing a concept before larger investment
- Single-use activation with no clear reuse case
- Budget constraints but need premium hardware
- Speed to market (rental providers have inventory)
Purchase makes sense when:
- Multi-event tour planned from the start
- Recurring annual activation (holiday campaigns)
- Need for deep customization or brand integration
- Hardware will be repurposed for retail or permanent use after events
6-4. Modular Design for Multi-event ROI
The smartest event teams plan for reuse from day one:
- Modular hardware that packs into standard road cases
- Software architecture that allows content swaps without redevelopment
- Scalable configurations (works in 10'x10' booth AND 30'x30' space)
- Documentation for third-party setup (reduces on-site team costs)
A $120K installation used at 4 events costs $30K/event. A $50K installation used once costs $50K/event. Plan accordingly.
7. Measuring Success: ROI Metrics for Event Installations
7-1. Engagement Metrics
| Metric | What It Measures | Target Range |
|---|---|---|
| Stop Rate | % of passersby who stop to look | 10-25% |
| Engagement Rate | % of stoppers who interact | 30-60% |
| Dwell Time | Average time spent interacting | 45-120 seconds |
| Completion Rate | % who reach the experience "end" | 60-80% |
| Repeat Rate | % who come back or replay | 10-30% |
7-2. Lead Capture & CRM Integration
- Email collection rate: What % of engaged visitors provide email?
- Lead quality score: How do event leads compare to other channels?
- CRM attribution: Can you track from event engagement → opportunity → close?
7-3. Social Metrics
- UGC rate: What % of engaged visitors share content?
- Hashtag volume: How many posts use the campaign hashtag?
- Earned impressions: Total reach of user-generated content
- Sentiment: What are people saying about the experience?
7-4. Post-event Attribution
The most sophisticated teams connect event engagement to downstream outcomes:
- Post-event site traffic: Spike in visits from event locations
- Sales lift: Compare regions/stores with vs. without activation
- Brand recall studies: Survey-based measurement of awareness impact
- Account progression: For B2B, did engaged accounts advance in pipeline?
8. Logistics & Technical Planning
8-1. Site Survey Essentials
Before committing to a concept, understand your venue:
- Power: Available circuits, distance to installation location, dedicated vs. shared
- Connectivity: WiFi availability and reliability, cellular backup options
- Lighting: Ambient light levels, controllability, competitor interference
- Space: Exact footprint, ceiling height, floor material, traffic flow patterns
- Load-in: Access hours, elevator/door dimensions, union requirements
8-2. Power, Connectivity, and Environmental Factors
Power planning:
- Calculate total wattage (screens, compute, lighting)
- Plan for 20% overhead
- Identify circuit breaker locations
- Bring power distribution (never depend on venue)
Connectivity:
- Never rely solely on venue WiFi (bring backup)
- Test cellular coverage at exact location
- Consider offline-capable mode for critical experiences
Environment:
- Outdoor events need weather protection
- Temperature affects hardware performance
- Direct sunlight washes out screens
8-3. Setup/Teardown Timelines
| Event Type | Typical Setup Window | Typical Teardown |
|---|---|---|
| Trade show | 4-8 hours | 2-4 hours |
| Mall pop-up | Overnight (8-12 hours) | 4-6 hours |
| Festival | 1-2 days | Same day strike |
| Product launch | 1-2 days | Next morning |
Always add buffer time. Venue surprises are the rule, not the exception.
8-4. Staff Training & On-site Support
Event staff often change from event to event. Plan for:
- Quick-start guide: 1-page visual reference for common scenarios
- Troubleshooting card: "If X happens, do Y"
- Training session: 30-60 minutes before event opens
- Escalation path: Who to call when something breaks
8-5. Contingency & Backup Plans
Murphy's Law applies to events. Plan for:
- Hardware failure (spare components on-site)
- Power outage (graceful shutdown, fast restart)
- Connectivity loss (offline mode or cached content)
- Staffing gaps (cross-training, documentation)
9. Common Pitfalls (and How to Avoid Them)
1. Starting too late in the planning cycle
- Interactive installations need 8-12 weeks minimum
- "We have 4 weeks" means compromises or failure
- ✅ Start conversations 3-4 months before event date
2. Underestimating setup complexity
- "It's just a screen" ignores mounting, power, calibration, testing
- Venue restrictions add surprises
- ✅ Conduct site survey early; add buffer time
3. Ignoring venue constraints
- Power limits, noise restrictions, lighting challenges
- Union rules, safety regulations, neighbor brands
- ✅ Get venue specs before finalizing design
4. No pre-defined success metrics
- "It looked cool" isn't a KPI
- Post-event "what did we achieve?" scrambling
- ✅ Define 2-4 core metrics before build starts
5. Overcomplicating the interaction
- More features ≠ better experience
- Complexity kills throughput at high-traffic events
- ✅ Start with one interaction, nail it, then consider additions
6. Forgetting the teardown
- Everything that goes up must come down
- Often overnight, often with tired staff
- ✅ Design for fast, documented teardown
10. What Success Looks Like: Representative Scenarios
The following scenarios illustrate typical outcomes for well-executed event installations. While not specific client case studies, they represent realistic results based on industry patterns.
10-1. Fashion Brand Pop-up: AR Try-On Experience
Scenario: A fashion brand launches a 2-week pop-up with an AR mirror that overlays digital accessories on visitors' reflections, with instant photo output.
Typical results for this format:
- 500-800 interactions per day
- 60-70% output capture rate (email for photo)
- 1-3M earned impressions from UGC
- 25-40% of email captures convert to e-commerce within 30 days
Key success factor: The "takeaway" (photo with virtual accessories) creates both lead capture and organic amplification.
10-2. Trade Show Booth: Product Configurator
Scenario: A B2B company deploys an interactive product configurator at a major trade show—an 85" multi-touch display where visitors build custom configurations, with results emailed to their inbox.
Typical results for this format:
- 200-400 qualified leads per day
- Average dwell time: 3-5 minutes (vs. 30-60 seconds at static booths)
- 15-25% of leads request sales follow-up
- ROI: 200-400% of booth investment through attributed pipeline
Key success factor: Interactive beats brochures for complex products. The configurator qualifies leads during the interaction.
10-3. Mall Holiday Activation: Gesture-Driven Photo Experience
Scenario: A department store deploys a 3-week holiday activation—a large LED wall where families "control" falling snow and characters through gestures, culminating in a branded family photo.
Typical results for this format:
- 800-1,200 family interactions per day
- 80-90% request photo output
- Store traffic +10-20% vs. same period previous year
- Social mentions increase 200-400%
Key success factor: Multi-generational design (kids AND parents can play) maximizes throughput and shareability.
11. Roadmap: From Concept to Installation in 8-12 Weeks
Step 1: Define Goals & KPIs (Week 1-2)
- What business outcome are we driving?
- What does success look like?
- What's the budget range?
- Who are the target personas?
Step 2: Concept & Creative Development (Week 2-4)
- Interaction design and user flow
- Visual concept and brand integration
- Technical feasibility assessment
- Venue coordination and site survey
Step 3: Technical Design & Hardware Selection (Week 4-6)
- Software architecture and development plan
- Hardware specification and sourcing
- Fabrication design (if custom elements)
- Analytics and lead capture integration
Step 4: Build & Testing (Week 6-10)
- Software development and content creation
- Hardware assembly and configuration
- Internal testing and iteration
- Client review and refinements
Step 5: Installation, Training & Launch (Week 10-12)
- On-site setup and calibration
- Staff training and documentation
- Soft launch and final adjustments
- Event execution and monitoring
For complex installations or multi-event tours, add 2-4 weeks.
12. About Utsubo: Your Partner for Event Installations
Utsubo is a creative studio specializing in interactive installations and web experiences.
For event work specifically, we offer:
- Modular design philosophy: Build once, deploy many times
- Full-stack capability: Concept through installation through analytics
- Event-ready mindset: We understand setup windows, venue constraints, and "it must work at 9am" pressure
- Post-event optimization: Analytics dashboards and iteration recommendations
If you've seen event activations that look great but don't drive measurable outcomes, we can help you build something that does both.
See how we approach choosing the right studio for your project.
13. Book a Free 30-Minute Planning Call
If you're evaluating an interactive installation for an upcoming event, pop-up, or trade show, book a free 30-minute call. We'll help you map:
- The right experience format for your event type and audience
- Realistic timeline and budget for your goals
- Measurement strategy that proves ROI
Book a call:Schedule your call
14. Event Installation Checklist
- Event goals and KPIs defined before creative development
- Installation concept understandable in 5 seconds or less
- Experience works for solo visitors AND groups
- Multi-language support (or language-independent design)
- "Takeaway output" designed for social sharing (photo, video, digital asset)
- Lead capture integrated (QR, email, CRM)
- Site survey completed (power, space, lighting, load-in)
- Setup/teardown timeline tested or rehearsed
- On-site staff trained on troubleshooting basics
- Backup/contingency plan documented
- Success metrics trackable (dwell time, completion, leads, UGC)
- Post-event debrief scheduled to capture learnings
FAQs
How far in advance should we start planning an interactive pop-up installation? For most event installations, plan for 8-12 weeks from kickoff to launch. This allows adequate time for concept development, technical build, testing, and site preparation. For complex immersive experiences or multi-event tours, add 2-4 additional weeks. Starting conversations 3-4 months before your event date gives you flexibility for iteration and reduces rush charges.
What's the minimum budget for an event installation with interactive elements? Functional event installations typically start around $30,000-$50,000 for a single-screen setup with basic gesture interaction and photo output. Mid-tier activations with multi-user capability, lead capture, and reusable design run $75,000-$120,000. Premium immersive experiences designed for multi-event tours range from $150,000-$250,000+. The key is matching scope to budget and planning for reuse to maximize ROI across multiple events.
Can the same installation be reused across multiple events or locations? Yes—if designed for it from the start. Modular installations that pack into road cases, use standard power, and have software that allows easy content swaps can be deployed across 5-10+ events. This dramatically improves per-event ROI. We recommend specifying reuse requirements upfront so the architecture supports easy reconfiguration.
How do you handle venue restrictions on power, noise, or lighting? Site surveys are essential. We assess power availability (circuits, wattage limits), ambient lighting (and whether it can be controlled), noise regulations, and neighboring installations before finalizing any design. We bring our own power distribution, plan for offline capability, and design visuals for the actual lighting conditions—not ideal ones. When restrictions are significant, we adjust the concept rather than fight the venue.
What happens if something breaks or malfunctions during the event? Contingency planning is built into our process. We spec spare components on-site for critical hardware, design software with graceful degradation (so partial failures don't kill the whole experience), and provide escalation paths for technical issues. Quick-start guides and troubleshooting cards enable on-site staff to resolve common issues. For premium activations, we offer on-site technical support throughout the event.
How do you train temporary event staff to manage and troubleshoot the installation? We provide a 30-60 minute training session before event opening, covering normal operation, common issues, and escalation procedures. Staff receive a 1-page visual quick-start guide and a troubleshooting card with "if X, do Y" instructions. We also cross-train multiple staff members and provide phone/text support during event hours. Documentation is designed for people seeing the installation for the first time.
How do you measure ROI for a temporary interactive installation? We define success metrics before build: engagement metrics (stop rate, dwell time, completion), lead capture (emails collected, CRM integration), social metrics (UGC rate, hashtag volume, earned impressions), and post-event attribution (site traffic, sales lift, pipeline progression). Analytics dashboards provide real-time visibility during the event and summary reporting after. The key is establishing baselines and targets upfront so "success" isn't subjective.
What's the difference between renting and purchasing an interactive installation? Renting is ideal for testing concepts, single-use activations, or when budget constraints require premium hardware without ownership costs. Purchasing makes sense for multi-event tours, recurring annual activations, or when the hardware will be repurposed for permanent retail/showroom use. Many clients start with a rental pilot, prove the concept, then commission a custom owned installation for ongoing use.
 Osaka Interactive Installation Studio