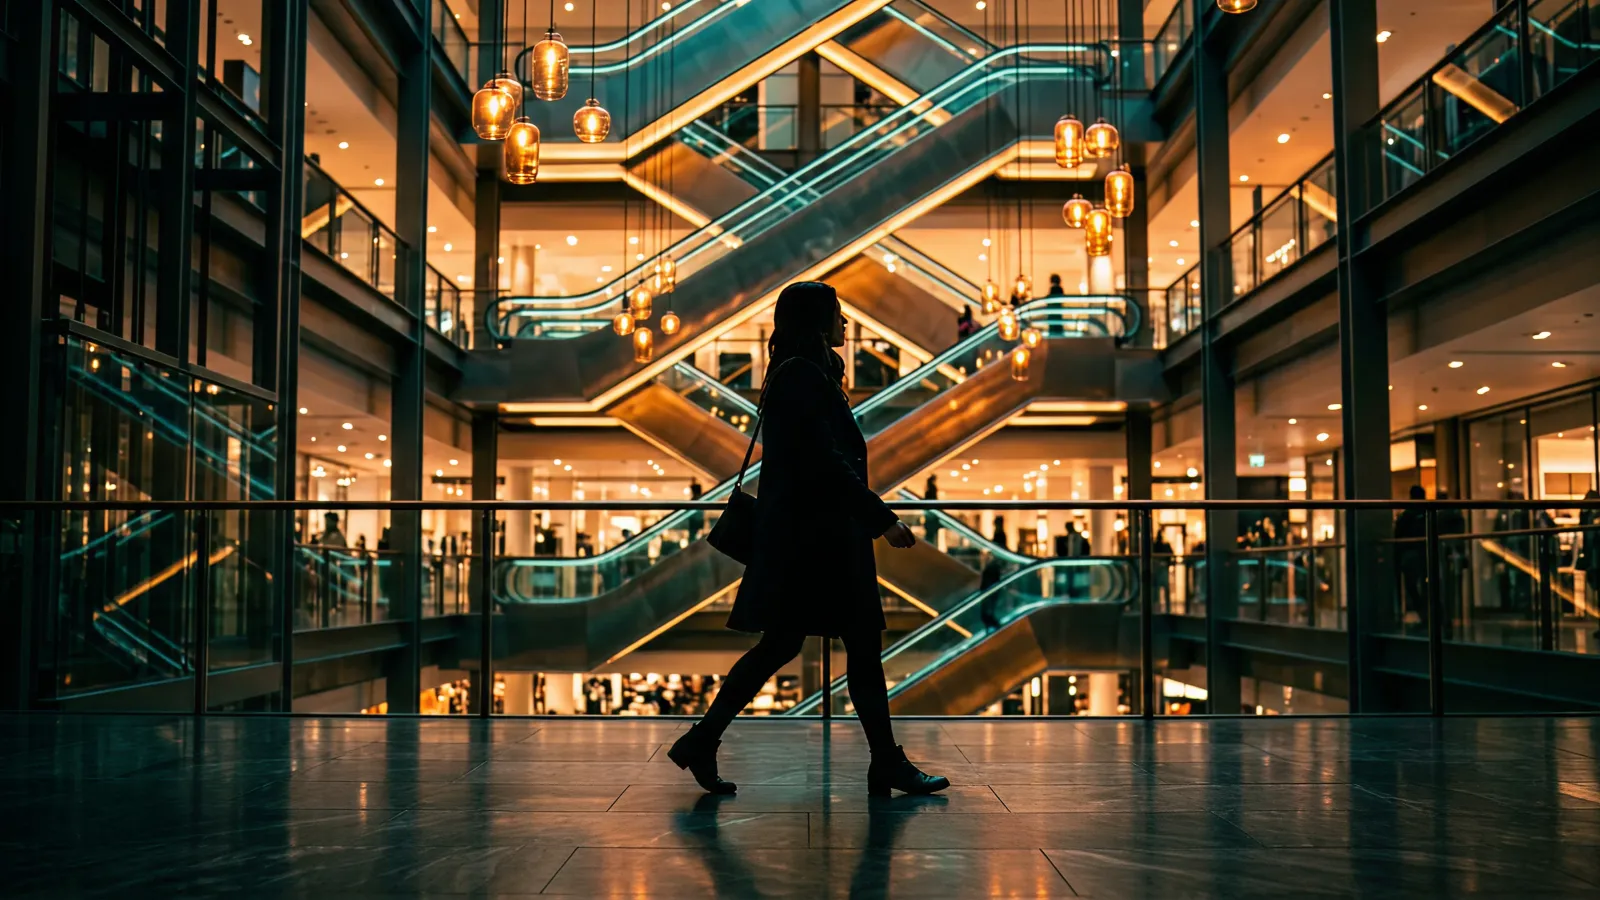
Japan's department store industry is not dying. It's bifurcating.
In 2024, the country's 178 department stores posted ¥5.77 trillion in sales—up 6.8% year on year, the fourth consecutive annual gain, and 3.6% above pre-pandemic 2019 (日本百貨店協会). Isetan Shinjuku alone hit a ¥421 billion single-store record. Osaka crossed ¥1 trillion in regional sales for the first time in 20 years. Yet in the same window, Tokyu Honten Shibuya closed after more than 50 years, Sogo Yokohama is gone, and Seibu Shibuya will shutter in September 2026 after 58 years on the ground.
The pattern is clear: flagships invested in experience are winning. Stores that kept treating themselves as warehouses are closing.
This guide is for the people inside Japanese department store groups who own that next investment decision. We map the four reinvention playbooks flagships are actually using, with named cases, budget bands in yen, internal-ownership notes, and a buyer's RFP checklist.
Who this is for: VMD (visual merchandising) directors, 催事 / event planning managers, group merchandising directors, and experiential marketing leads at Isetan Mitsukoshi Holdings, J. Front Retailing (Daimaru-Matsuzakaya), H2O Retailing (Hankyu-Hanshin), Takashimaya HD, and other regional chains—plus the brand, agency, and capex teams advising them.
Key Takeaways
- The industry is bifurcating. Flagships in Tokyo, Osaka, and Fukuoka grew in 2024; regional stores keep closing. Experience capex is the dividing line.
- Four playbooks are working right now: theater-type programming (Hankyu Umeda), gallery-type curation (Ginza Six, Isetan Shinjuku), depachika-as-experience (Mitsukoshi, Takashimaya), and AR/XR + smart signage overlays (Matsuzakaya Shizuoka, Daimaru, Ginza Mitsukoshi).
- Inbound spend is rotating from goods to experiences. 2024 set a tax-free record of ¥648.7 billion (+85.9% YoY), but 2025 duty-free softened (-12.7%) and May saw a -41% drop across 80+ stores. Diversifying beyond goods is now urgent.
- Budget bands are wide. A signage / XR overlay can ship at ¥5M–¥30M in 8–12 weeks. A named-artist atrium piece runs ¥80M–¥300M+ over 20–32 weeks. A full floor renovation with permanent experiential layer is ¥300M+ over 9–18 months.
- Internal ownership is the real bottleneck. Theater-type programs need event/催事 teams plus building maintenance. Gallery-type needs curation partnerships. XR layers need VMD + DX teams working together.
- Vendor lock-in and post-Olympic novelty fatigue are the two failure modes to design around from day one.
1. The Market Reality: Bifurcation, Not Death
The "death of the department store" headline is half right. The industry is half its 1991 peak—¥9.7 trillion then versus roughly ¥5.8 trillion today—and the regional contraction is real. But the top of the market is growing.
What's working in 2024:
- Total industry sales: ¥5.77T (+6.8% YoY), exceeding 2019 by 3.6% (繊研新聞)
- Inbound (tax-free) sales: ¥648.7 billion, +85.9% YoY—an all-time record (訪日ラボ)
- Osaka regional total: ¥1T, first time in 20 years (+14.2%)
- Fukuoka regional total: ¥257.6B record (+13.8%)
- Isetan Shinjuku: ¥421B single-store, the highest in Japan
- Isetan Mitsukoshi Holdings FY2024: record operating income of ¥74B
- Takashimaya FY2025 (ended Feb 2025): operating revenue +8.5%, profit +25%
What's not:
- Tokyu Honten Shibuya closed in 2023 after more than 50 years
- Sogo Yokohama closed in 2020
- Seibu Shibuya closes September 30, 2026 after 58 years—reportedly losing ¥1–2B per year (News on Japan)
- Sogo & Seibu was sold to Fortress Investment Group in August 2023 for ¥220B
- 2025 duty-free sales fell 12.7% YoY; May 2025 inbound tax-free across 80+ stores dropped 41%; calendar-year 2025 marked the first total decline in five years (Japan Times)
The takeaway for capex teams is uncomfortable but clear. Floor space alone no longer earns a department store its real estate. The flagships growing are the ones that have replaced "more SKUs per square meter" with "more reasons to be in this building."
That's where the four playbooks come in.
2. Playbook 1 — Theater-Type (The Hankyu Umeda Model)
Hankyu Umeda Main Store is the clearest example of treating a department store as a stage, not a shelf.
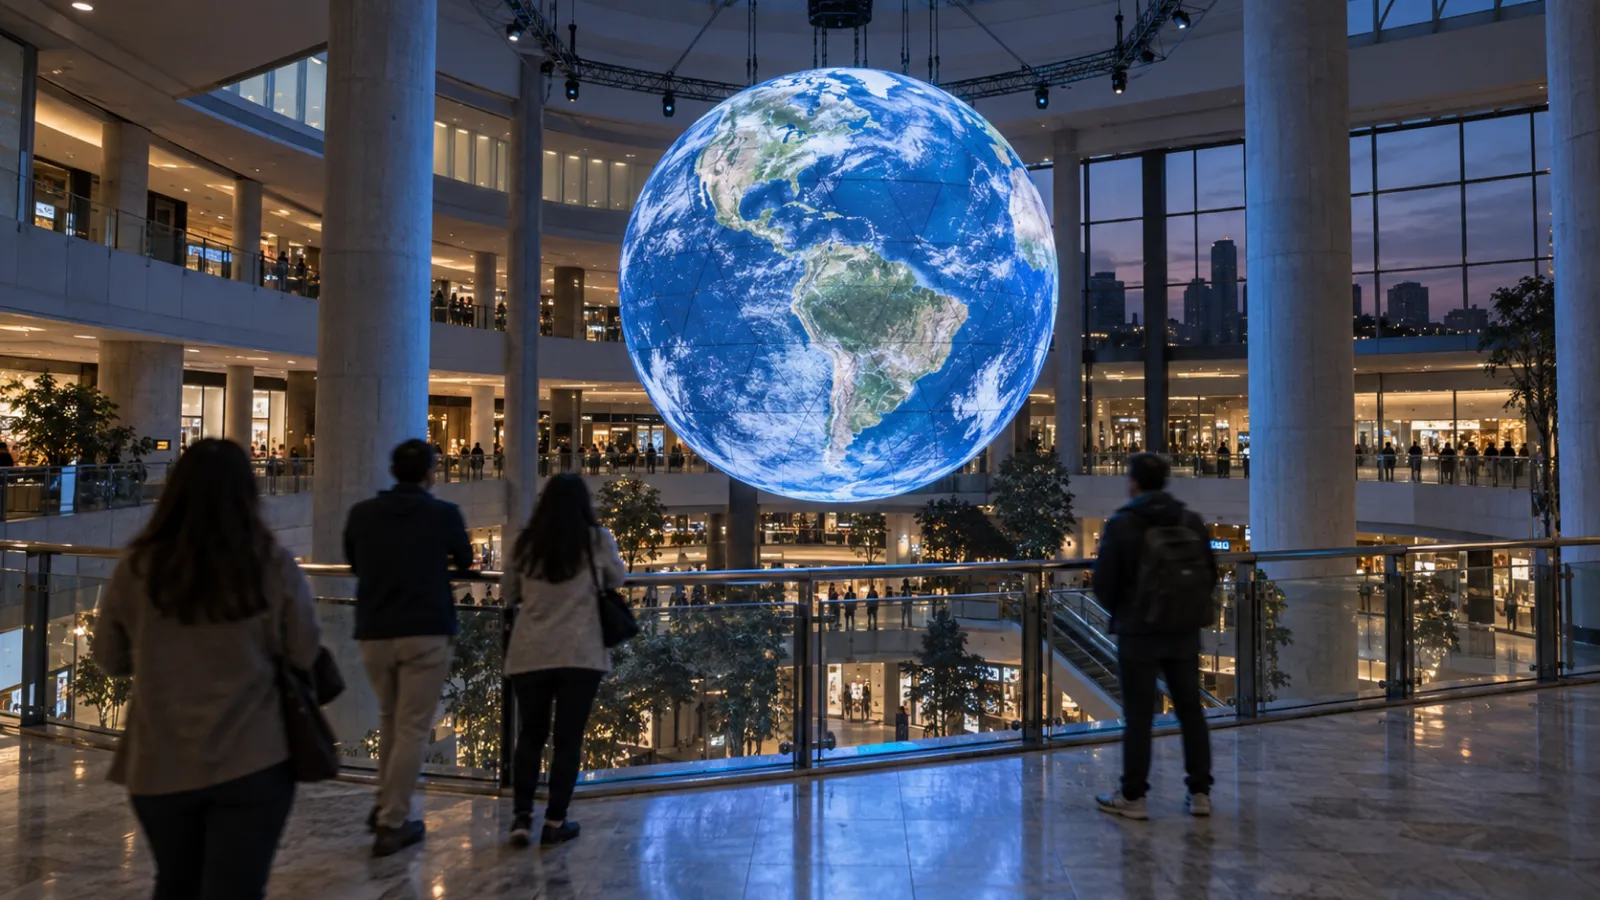
The reconstructed building (reopened 2012, seven years in the making) features a 16-meter-high atrium spanning the 9th to 12th floors and a 9F Festival Plaza purpose-built for entertainment, limited-time markets, and cultural programming. The store calls itself a "theater-type department store" and brands its maker-storytelling format as "Kotokoto Live"—a recurring format where designers and craftspeople share the cultural context behind their products.
Recent programming scale signals the bet. The 2024 Valentine's Day Chocolate Expo at Hankyu Umeda Main targeted ¥3 billion+ in event sales alone (PR Newswire). That's an event budget that would be impossible without a recurring atrium-scale venue inside the store.
H2O Retailing's sister flagship, Hanshin Umeda Main Store, reopened in April 2022 after a major renovation in the same direction—merging shopping with cultural programming inside a renewed atrium.
What it actually costs (theater-type):
- Permanent atrium / festival plaza infrastructure: ¥300M+ as part of floor renovation
- Per-event programming (seasonal催事): ¥20M–¥80M typical, larger anchor events ¥100M–¥300M
- Lead time per event: 12–16 weeks from concept to opening
Who owns it internally:
- 催事 / event planning team (program calendar, vendor selection)
- Building operations (atrium load, rigging, fire compliance)
- Group merchandising director (capex approval for atrium build-out)
- Marketing / PR (cross-store campaign integration)
When this playbook fits: Flagships with existing high-traffic atrium space (or post-renovation flagships that can build it in). Theater-type is the highest fixed cost, but it amortizes across dozens of events per year and becomes a foot-traffic engine.
For event-tier work specifically, our pop-up and event interactive installation guide covers the activation patterns that pair well with theater-type venues.
3. Playbook 2 — Gallery-Type (Ginza Six, Isetan Shinjuku)
Where theater-type uses the building as an active stage, gallery-type uses it as a curated cultural venue. The space stays calmer, the rotation is slower, the named artists do more of the work.
Ginza Six is the textbook case. Built on the former Matsuzakaya Ginza site, it opened in 2017 with a 4-floor central atrium designed from day one to host major artist commissions. Recent rotations include a Julian Opie installation that took over the central atrium in 2024–25 (Time Out Tokyo), and inside the Fendi 4-floor flagship a suspended floral chandelier by Makoto Azuma.
Isetan Shinjuku runs a parallel program in its Arts and Creation event hall on the 6th floor of the main building, with rotating contemporary art, illustration solo shows, and gallery exhibitions designed to bring an art-museum audience into the store on weekdays.
Mitsukoshi Nihombashi has a long-standing 7F gallery program—the same building hosted a teamLab digital installation (SUKIKEI) in 2020 as a precedent for major immersive work.
What it actually costs (gallery-type):
- Named-artist atrium installation: ¥80M–¥300M+ (commission + fabrication + install + insurance)
- Curatorial partnership retainer: ¥20M–¥60M / year
- Rotating gallery program: ¥10M–¥40M per show, 4–8 shows / year typical
- Lead time: 20–32 weeks for named-artist work; 8–12 weeks for smaller gallery rotations
Who owns it internally:
- Group art / cultural program director (often reports to group MD or CEO at flagship)
- Curatorial partner / external gallery (Art Front Gallery, Mizuma Gallery, Pace, etc.)
- VMD lead (integration with tenant-floor sightlines)
- PR (press release cadence, art-press relationships)
When this playbook fits: Stores already positioned in the luxury / high-end segment where art adjacency reinforces brand premium (Ginza, Nihombashi, Shinjuku flagship core). Gallery-type does less for foot traffic than theater-type, but it does more for dwell time, social proof, and association with tenants' luxury identities.
4. Playbook 3 — Depachika-as-Experience (B1 Sensory Model)
The single most underrated experiential surface in Japanese retail is the depachika (デパ地下)—the gourmet food hall on B1, sometimes B2, of every major department store. The format emerged in the 1960s and is now a uniquely Japanese answer to "why come to a building when you can buy online."
The depachika works because it is, by design, a multi-sensory installation that happens to sell food. Visual cases choreographed like a museum. Aromas managed at zone boundaries. Service trained as omotenashi—not a slogan, an operating system. Seasonal product theater synchronized to the Japanese calendar (御中元 mid-year gifts, 御歳暮 year-end gifts, 桜餅 spring, おせち New Year). Lighting and sound dialed in floor by floor.
Why the depachika is the best ROI experiential surface in the building:
- Highest foot traffic of any floor (the train-station entry typically connects to B1)
- Self-funding through food sales—the experience pays for itself even when traffic is the goal
- Cultural defensibility: hard to copy outside Japan, which is exactly why Mitsukoshi exported its depachika concept to One Bangkok as a branded IP
Shibuya Takashimaya, post-refurbishment, is regularly cited as the #1 Tokyo food hall, paired with a rooftop garden picnic space (Just One Cookbook).
What "interactive installation" looks like inside a depachika in 2026:
- Seasonal lighting choreography tied to product calendar
- Scent-zoning between wagashi (Japanese confectionery), savory, and bakery
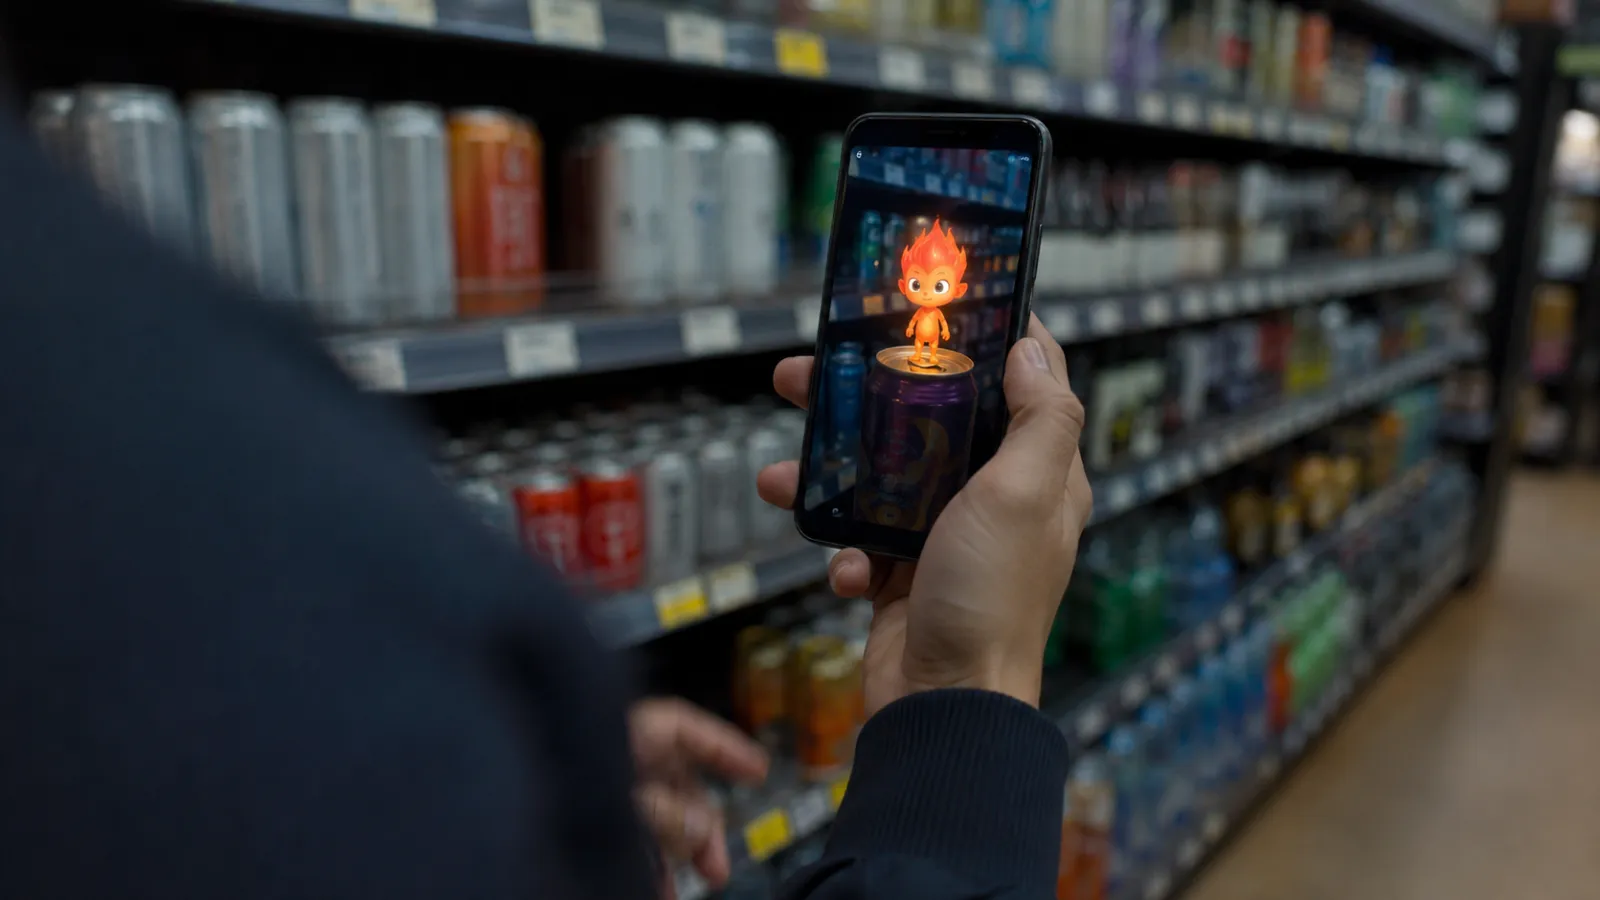
- AR overlays on gift packaging (multilingual ingredient stories, sourcing provenance)
- Display cases that animate when a customer dwells (proximity-triggered storytelling)
- Theater windows for new-product launches (single chef / single house, week-long)
The sound design alone is a major lever. See our sound design for interactive installations guide for the production budget bands and silence-as-design-choice framing that applies directly to depachika contexts.
What it actually costs (depachika layer):
- Single seasonal催事 installation: ¥5M–¥20M, 8–10 weeks lead time
- Permanent sensory upgrade (lighting + sound + display cases): ¥40M–¥120M as part of B1 renovation
- AR / digital signage layer over existing depachika: ¥10M–¥40M, 8–14 weeks
Who owns it internally:
- B1 floor manager (food safety, hygiene compliance for any sensor or device near food)
- 催事 / event planning team (calendar of brand collaborations and seasonal anchors)
- VMD (case design, lighting program)
- Marketing (inbound multilingual coverage, gift culture programming)
When this playbook fits: Every store. The depachika is the single playbook every Japanese flagship and most regional stores can run with the highest revenue-to-experience-spend ratio.
5. Playbook 4 — AR / XR & Smart Signage Overlay
The lowest-capex entry point into the experiential layer is the technology overlay: AR, XR, multilingual smart signage, and digital fitting—added to an existing floor without renovation.
Three named 2024 cases show what's actually shipping in Japan:
Matsuzakaya Shizuoka #XR水族館 (February–April 2024). QR-triggered AR content placed sea creatures swimming through the streetscape between Shizuoka Station and the Matsuzakaya entrance, and added mini-AR characters around posters and digital signage inside the building. The activation explicitly bridged the urban approach (inbound + commuter traffic) and the store interior, turning the walk in into part of the campaign.
Daimaru Matsuzakaya digital fitting (大丸松坂屋). A special mirror-glass digital signage panel paired with a camera lets customers see their back view and walking motion in real time—the kind of thing impossible with a static mirror. Implemented by Cloud Point (クラウドポイント事例).
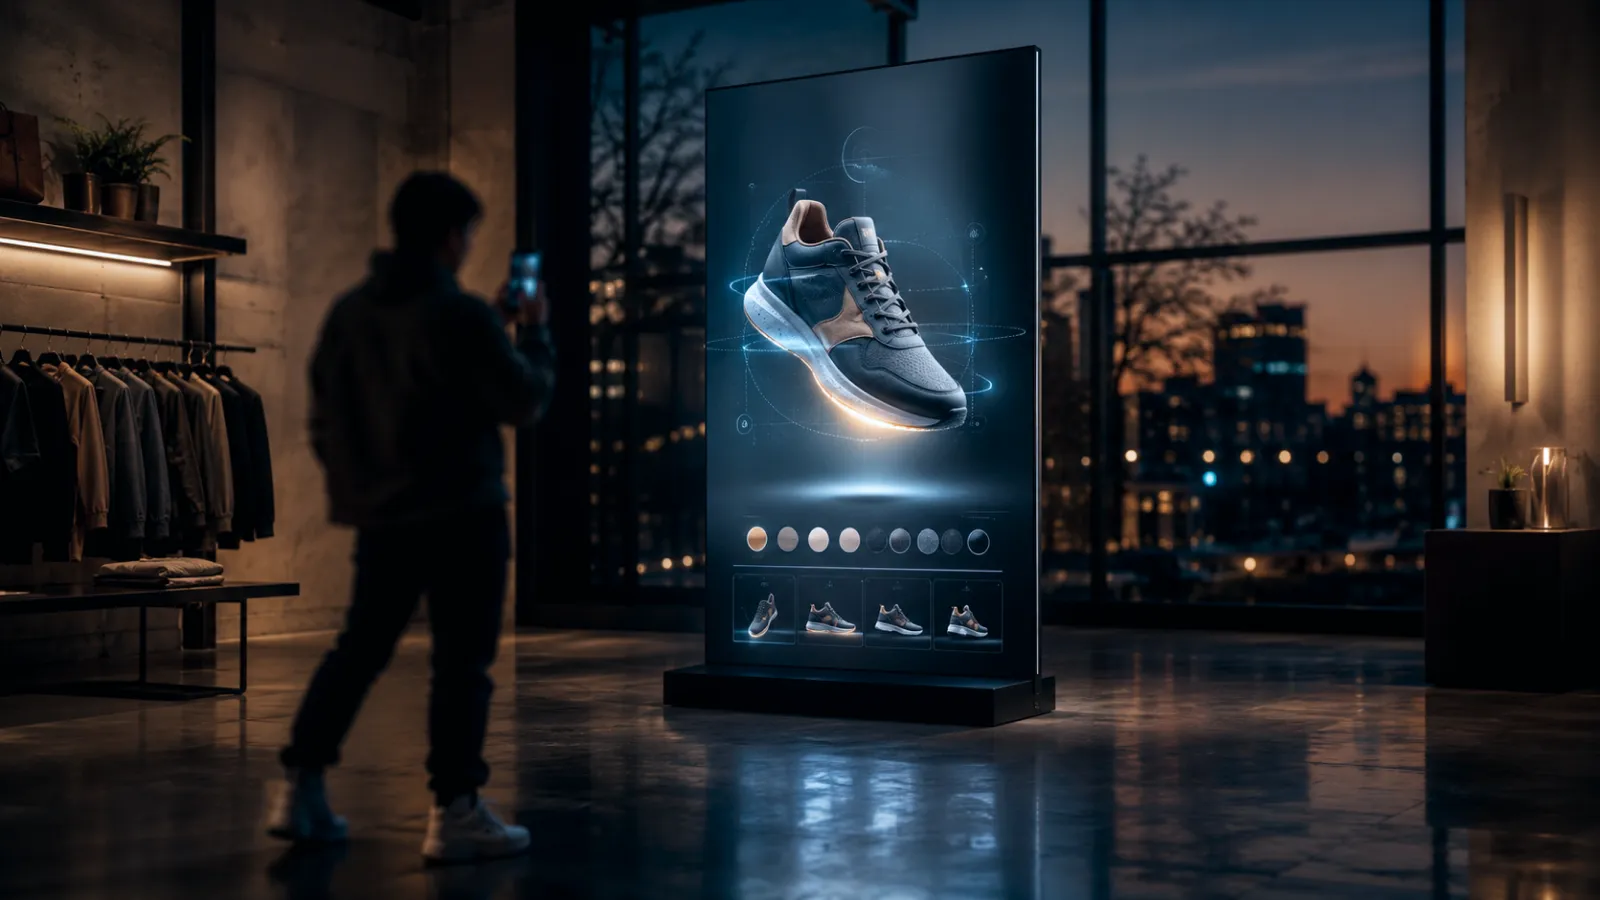
Ginza Mitsukoshi B1 multilingual signage. A Will Smart digital signage system on the B1 cosmetics floor, supporting five languages with combined wayfinding and seasonal promotion content. Engagement reportedly doubled versus the previous static signage (日刊工業).
These are the cases that prove the overlay tier works as a first capex commitment—not a five-year renovation, not a named-artist commission, but a deployable experiential layer that can be measured against a baseline.
What it actually costs (XR / signage overlay):
- Single-store AR campaign (8–12 weeks): ¥5M–¥20M
- Multilingual smart signage rollout (single floor, 8–10 displays): ¥10M–¥30M
- Digital fitting / smart-mirror pilot: ¥8M–¥25M per location
- Chain-wide signage system rollout: ¥80M–¥250M over 12–18 months
Who owns it internally:
- VMD (floor placement, content design)
- DX / digital marketing team (CMS, content updates, language coverage)
- Inbound / tax-free operations (language coverage prioritization)
- Legal / compliance (個人情報保護法 review for any camera or sensor data)
When this playbook fits: Every store, especially as a first capex tier before committing to a larger renovation. The XR overlay also doubles as inbound-experience differentiation—directly addressing the language and discovery gaps that hurt non-Japanese visitors.
6. Inbound 2026: The Goods-to-Experience Shift
The single biggest strategic shift behind the four playbooks is happening on the demand side, not the supply side. Inbound tourists in 2026 are shifting their spending from goods to experiences (体験消費).
Inbound at Isetan Mitsukoshi's flagship stores now contributes more than 15% of total revenue (MatrixBCG). Even at the system level, 2024's record ¥648.7B in tax-free sales pushed inbound to a structural revenue line, not a bonus.
But 2025 is telling a more complicated story. Tax-free sales fell 12.7% YoY, and a single month (May 2025) was down 41% across 80+ stores (JapanConsuming). Some of this is currency volatility. Some of it is a real behavior shift: tourists who already own the bag, the watch, the cosmetic line now want the memory.
The implication for capex is direct. Stores that earn inbound traffic in 2026–27 will be the ones with experiences worth flying for, not just stockrooms worth shopping in. The four playbooks above are exactly how flagships are building that.
This goods-to-experience rotation maps onto a broader debate we cover in our digital vs physical experience guide—where the budget split for retail typically lands around 50/50 between digital storefronts and physical experiential investment.
7. Budget Bands & Timelines
Real numbers for the four playbooks, expressed in JPY for Japanese capex teams.
| Tier | What it covers | Budget band | Lead time | Best playbook fit |
|---|---|---|---|---|
| A | Signage / XR overlay (single floor, single campaign) | ¥5M–¥30M | 8–12 weeks | Playbook 4 |
| B | Pop-up gallery, depachika seasonal催事, single named installation | ¥20M–¥80M | 12–16 weeks | Playbooks 1, 2, 3 |
| C | Atrium-scale named-artist installation, major event series | ¥80M–¥300M+ | 20–32 weeks | Playbook 1, 2 |
| D | Floor renovation with permanent experiential layer | ¥300M+ | 9–18 months | Playbooks 1, 3 (depachika renewal) |
A few notes from running this exercise with department-store buyers:
- Tier A is where most stores should start. The data signal it produces (engagement lift versus previous-format baseline) is the case that unlocks Tier B and C approval cycles.
- Tier B is the highest-ROI band per yen spent for stores with existing atrium or gallery infrastructure already in place.
- Tier D is usually triggered by an unrelated event—a building seismic retrofit, a tenant repositioning, a holding-company merger—rather than as a standalone capex decision.
- Fabrication costs in Japan run 1.5–2.0× European or US benchmarks because of labor scarcity and the high baseline of finishing quality expected by the buyer.
For context on installation cost ranges across all venue types, see our retail interactive installation guide, which covers experiential retail outside the department store vertical.
8. RFP Checklist for VMD & Event Teams
When you brief a vendor for any of the four playbooks, make sure the RFP and the contract cover these items.
- Brief clarity. A single-page brand and audience brief, with the one or two KPIs the installation must move (stop rate, dwell time, completion rate, sales lift, CRM sign-ups, social shares).
- KPI definition. Pre-installation baseline measured. Post-installation measurement window agreed. Reporting cadence written into the contract.
- 個人情報保護法 compliance. Any camera, sensor, or anonymous-analytics device reviewed by legal. Privacy-first defaults documented (no face image storage, no identifiable retention).
- Multilingual coverage. Minimum Japanese + English; for inbound-heavy stores add Chinese (simplified + traditional), Korean, and at least one European language.
- Accessibility. Wheelchair sightlines. Captioning for any audio-narrated content. No interaction that requires hearing or sight as a single mode.
- Vendor warranty & maintenance. Minimum 12-month hardware warranty. Content refresh cadence agreed (quarterly minimum for permanent installations).
- Content ownership. Source files, executable builds, and update tooling owned by the store, not the vendor. Avoid vendor lock-in on day one.
- Hygiene compliance (depachika contexts). Any device near food approved by B1 floor management. Materials and finishes spec-checked.
- Post-event analytics. Raw data and dashboard delivered. Recommendations for next iteration written into the close-out report.
- Insurance. Public liability, property damage, and (for named-artist work) art-handling insurance through fabrication, install, and run.
For more on RFP-stage best practices and how to brief a vendor effectively, see our how to brief an interactive installation studio guide.
9. Risks & Failure Modes
Five patterns to design around from day one.
Vendor lock-in. A single vendor controlling content updates, hardware swaps, and analytics is a five-year cost trap. Buy content ownership and CMS access upfront, even when the vendor pushes back.
AR / XR fatigue. A one-time AR campaign generates one round of social and one round of foot traffic, then collapses. Treat AR as a recurring program (quarterly rotations) or skip it. The Matsuzakaya Shizuoka XR水族館 worked because it was a defined campaign window, not an "AR experience" left running indefinitely.
Language gaps. Multilingual signage that covers Japanese + English only is a missed inbound opportunity. The Ginza Mitsukoshi 5-language deployment is the floor, not the ceiling.
Post-Olympic novelty drop. Many Japanese venues spent 2019–2021 capex on installations that were unique then and feel dated now. Plan for 24–36 month refresh cycles on any permanent experiential layer.
Depachika sensor-tech compliance. Cameras, scent dispensers, or any device near open food has hygiene and food-safety constraints that retail-floor vendors often don't anticipate. Bring B1 operations into the kickoff meeting, not the install week.
About Utsubo
Utsubo is an Osaka-headquartered creative studio building interactive installations and digital experiences for retail, museum, hotel, and brand clients across Japan and internationally. We work in both physical and digital experience, which is why we treat installations as a system—content, hardware, analytics, and operations—rather than a one-off build.
For Japanese department store work specifically, we bring:
- Geographic proximity to the Hankyu-Hanshin, Daimaru Shinsaibashi, and Takashimaya Namba flagships
- Cross-pillar fluency: theater-type programming, gallery-type curation, depachika sensory design, XR overlays
- Inbound-language coverage standard in every deployment
- 個人情報保護法 compliance baked into our analytics defaults
- Strategy → concept → build → install → analytics → iteration under one studio
Book a 30-Minute Planning Call
If you're evaluating an interactive installation program for a flagship or regional store—or auditing what your current capex is producing—book a 30-minute project call. We'll help map:
Which of the four playbooks fits your floor, audience, and capex band
A realistic Tier A pilot scope before committing to Tier B or C
KPI definition for your group's reporting cycle
Book a call:https://cal.com/utsubo/30min?source_url=%2Fblog%2Fdepartment-stores-interactive-installations-japan-guide
VMD / 催事 Team Checklist
- We've identified which of the four playbooks fits our store's existing infrastructure
- We have a Tier A pilot scoped at ¥5M–¥30M before committing to larger capex
- Our KPIs are defined pre-installation with a measured baseline
- Multilingual coverage includes at minimum Japanese + English + one Chinese variant
- 個人情報保護法 review is in the project plan, not a final-week surprise
- Content ownership and CMS access are in the contract
- We've defined a 24–36 month refresh cadence for any permanent layer
- B1 / depachika operations are in the project kickoff if the install touches the food floor
- We've benchmarked vendor cost against 1.5–2.0× European or US comparables
- We've reviewed inbound vs domestic audience mix and prioritized accordingly
FAQs
What's a realistic first budget for a Japanese department store interactive installation? For most stores, a Tier A pilot in the ¥5M–¥30M range is the right first commitment. This covers a single-floor signage or XR overlay, an 8–12 week deployment, and enough analytics to compare against your pre-installation baseline. The data this produces is what unlocks the larger Tier B and Tier C capex cycles internally.
Who typically owns this work inside Isetan Mitsukoshi HD, J. Front Retailing, H2O Retailing, or Takashimaya HD? Ownership splits across three teams. VMD (visual merchandising) owns the floor-level integration. 催事 / event planning owns the campaign calendar. The group merchandising director (or experiential strategy director) owns the capex envelope. For depachika work, B1 floor management is mandatory. For named-artist gallery work, a group cultural / art director is usually the lead.
Which playbook fits a regional store versus a Tokyo or Osaka flagship? Flagships with existing atrium or gallery infrastructure should run all four playbooks in parallel. Regional stores typically have the highest ROI from Playbook 3 (depachika upgrade) and Playbook 4 (XR + multilingual signage overlay), because both can ship without major renovation. Theater-type and gallery-type programs need the floor space and the foot traffic that regional stores rarely sustain.
Should we prioritize inbound or domestic audiences in 2026? Inbound revenue is structurally important (15%+ at flagship Isetan Mitsukoshi stores), but the 2025 tax-free softening (-12.7% YoY) is a reminder that inbound is volatile. The honest answer is design for both, with the experience optimized for domestic regulars and the multilingual / wayfinding layer optimized for inbound. The four playbooks all support this dual-audience design when scoped correctly.
Permanent installation versus seasonal催事—how do we decide? Use seasonal催事 to test demand and prove KPIs (8–16 week activations, Tier A or B). Convert to permanent only when the seasonal version has produced repeatable engagement and sales-lift data over at least two cycles. Most stores commit to permanent installation too early, then can't justify the refresh budget when the novelty fades.
How do we handle data privacy when sensors or cameras are involved? The starting position is privacy-first by default: no face image storage, no identifiable retention, aggregated counts only. The full 個人情報保護法 (Personal Information Protection Act) review should be in the project kickoff—legal review at the end of the project is the most common failure mode. Clear on-site signage in Japanese plus all relevant inbound languages is required, not optional.
What should we look for when selecting a vendor for this work? The top filters: portfolio depth in retail or department store contexts (not just events or museums), studio-side fluency in both physical fabrication and digital content, in-house analytics rather than outsourced reporting, content ownership and CMS access offered without pushback, and explicit experience with 個人情報保護法 compliance. See our how to choose an interactive installation studio guide for the full vendor-evaluation framework.


 Osaka Interactive Installation Studio