US college enrollment has declined for 12 consecutive years. The demographic cliff that higher education has been bracing for is no longer a forecast -- it's the operating environment. Between 2010 and 2025, undergraduate enrollment dropped by roughly 15%, and the steepest decline is still ahead as the post-2008 birth rate collapse reaches college age.
Yet some universities are growing. The differentiator isn't rankings or tuition discounts -- it's campus experience. Institutions investing in interactive, immersive campus environments report 15–25% higher tour-to-application conversion rates. The campus visit remains the single most influential factor in enrollment decisions, and interactive installations transform that visit from a walking tour into an experience that sticks.
This is the higher education extension of the experience economy: prospective students and their families now choose campuses for the moments they create, not just the programs they list.
This guide covers what university-grade interactive installations look like, where they work on campus, what they cost ($30K–$300K+), and how to measure their impact -- with real examples from Cornell Tech, MIT, Arizona State, Stanford, and more.
Who this is for: University presidents, provosts, admissions directors, advancement/development officers, campus architects, facilities managers, and anyone evaluating interactive technology for higher education environments.
Key Takeaways
- US college enrollment has declined ~15% since 2010 -- the demographic cliff hits hardest starting 2025, making campus differentiation a survival strategy.
- 75% of enrolled students visited campus before applying -- interactive installations transform the visit from a walking tour into a conversion event.
- Budget tiers range from $30K (single-room pilot) to $300K+ (multi-zone campus transformation), with running costs at 10–15% annually.
- Interactive donor walls see 3–5x more engagement than traditional plaques -- critical as millennials and Gen X become the primary donor demographic.
- Universities with immersive admissions experiences report 15–25% improvement in tour-to-application conversion rates.
- NSF and other granting bodies increasingly value broader impacts -- installations that visualize research output strengthen funding applications.
- International student recruitment benefits directly: immersive campus previews reduce the friction of committing to a university sight unseen.
1. Why Universities Need Interactive Installations Now
1-1. The enrollment cliff
The numbers are stark. US college enrollment has fallen by approximately 15% since 2010, driven by demographics that no marketing campaign can reverse. The cohort of 18-year-olds entering college will shrink significantly through the late 2020s -- a direct consequence of declining birth rates after the 2008 financial crisis. The National Student Clearinghouse Research Center has documented this trend year after year, and the steepest drop is still ahead.
For universities competing for a smaller pool of prospective students, the calculus has changed. Differentiation on campus experience isn't a luxury -- it's an enrollment strategy. Schools that invest in memorable, technology-forward environments signal innovation, modernity, and a commitment to student experience that resonates with Gen Z decision-making.
1-2. The campus visit is the #1 conversion event
75% of enrolled students visited campus before applying. That statistic from higher education enrollment research makes the campus visit the highest-leverage moment in the admissions funnel. A prospective student arrives uncertain and leaves either inspired or indifferent. Everything that happens during that 90-minute tour shapes the decision.
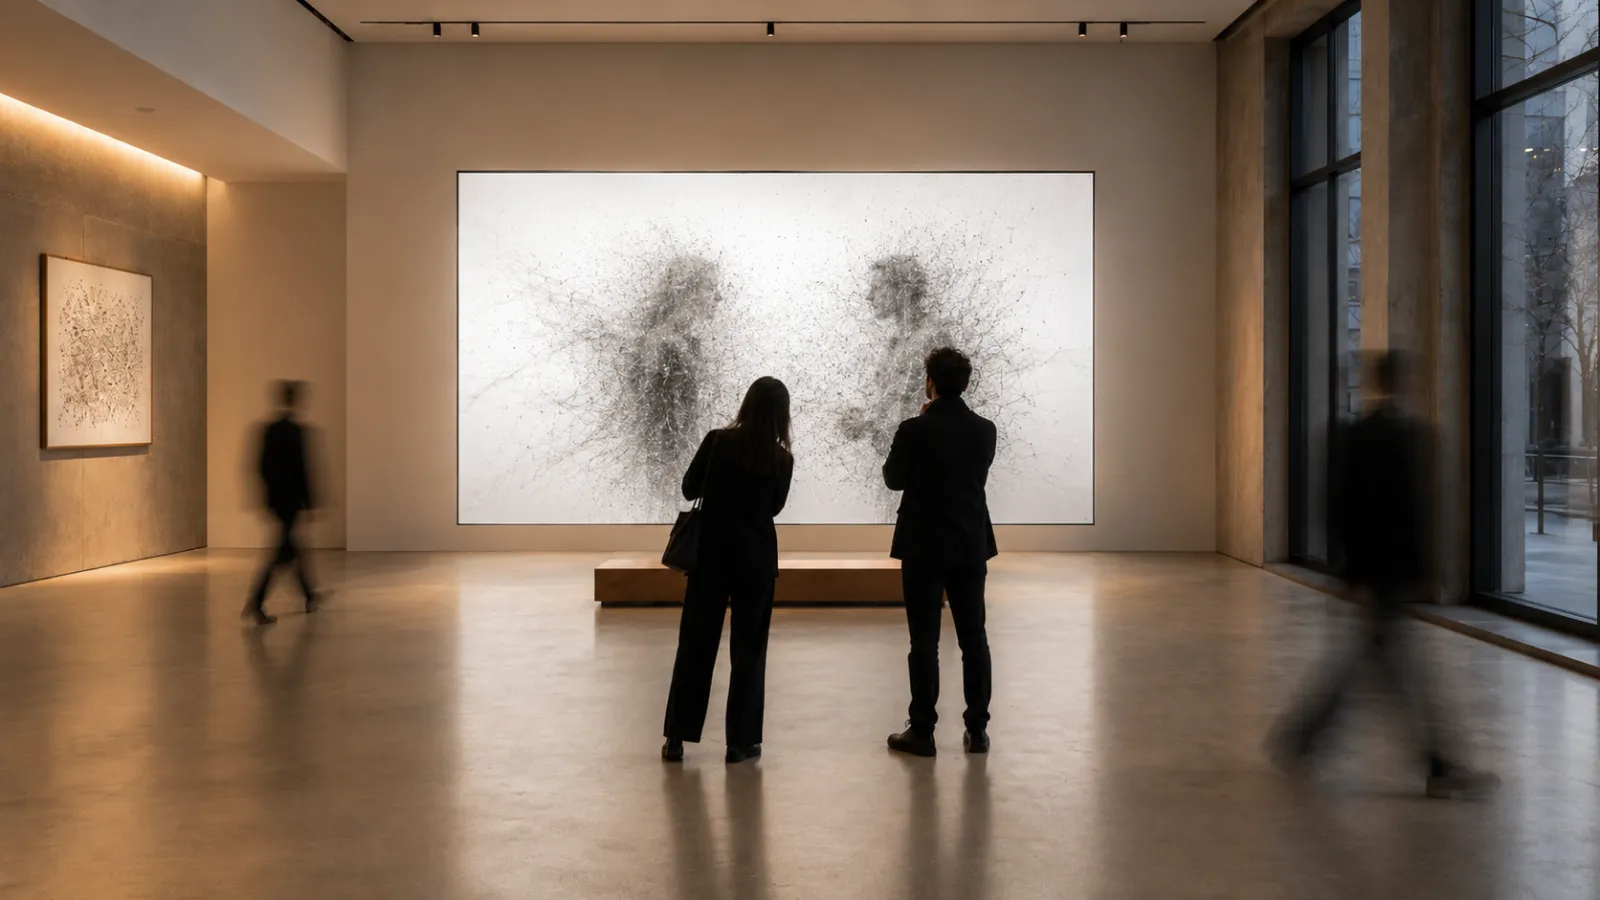
Interactive installations transform the visit from a passive walking tour into an active experience. A responsive data visualization in the welcome center, an immersive research showcase in the science building, or a generative art wall in the student union -- these moments create emotional anchors that persist long after the tour bus leaves. The psychology of digital awe explains why: immersive experiences trigger stronger memory encoding and emotional connection than static displays or verbal descriptions.
1-3. Donor engagement is moving digital
Millennials and Gen X are now the primary donor demographic for university advancement offices. They grew up with screens, and they expect digital recognition that goes beyond a name etched in stone. The traditional brass plaque in a hallway doesn't resonate the way it did with previous generations.
Interactive donor walls see 3–5x more engagement than static recognition displays. They can showcase giving impact in real time, connect donors to the students and programs their gifts support, and create shareable moments that extend recognition beyond the physical campus. For advancement teams running capital campaigns, an interactive donor wall isn't just recognition -- it's a cultivation tool that influences the next gift.
1-4. Research visibility equals funding
The National Science Foundation and other major granting bodies increasingly evaluate broader impacts alongside intellectual merit. Universities that can demonstrate public engagement with their research -- making the invisible visible -- strengthen their funding applications.
Interactive installations that visualize research data, simulate scientific phenomena, or let visitors explore complex datasets serve a dual purpose: they engage the campus community and visiting public while providing tangible evidence of broader impact for grant reporting. A physics department with a real-time particle collision visualization in its lobby tells a more compelling story than a department with a bulletin board of published papers.
2. What Are University Interactive Installations?
A university interactive installation is a digital experience that responds to visitor presence, touch, gesture, or data input -- transforming campus spaces from static environments into participatory ones.
The goal isn't spectacle for its own sake. It's strategic engagement: converting prospective students, recognizing donors, showcasing research, improving wayfinding, and creating a campus environment that retains current students.
Common formats:
- Interactive donor walls: Touch-enabled displays that showcase giving history, impact stories, and real-time campaign progress -- replacing static plaques with living recognition
- Admissions center experiences: Immersive rooms, interactive timelines, and data-driven visualizations that bring the university's story to life during campus tours
- STEM engagement exhibits: Hands-on installations in science buildings that let visitors interact with research data, simulations, and scientific concepts
- Digital wayfinding systems: Touch and gesture-based navigation kiosks that help visitors and students navigate complex campuses
- Research visualization displays: Real-time data feeds from labs, observatories, weather stations, or IoT sensors presented as visual experiences
- Student commons installations: Generative art, social media walls, and interactive surfaces in student unions and gathering spaces
- Alumni engagement platforms: Interactive displays that connect current campus life with alumni networks, featuring class histories and alumni achievements
The distinction from static digital signage matters: signage broadcasts a message, while installations create a two-way interaction that generates engagement, dwell time, and emotional connection. For more on this distinction, see our guide on museum interactive installations, which covers many of the same principles.
3. Campus Zones for Installation
Not every square meter of campus needs an installation. The best deployments target high-traffic zones where visitors form impressions -- arrival moments, decision points, and gathering spaces.
3-1. Main entrance and welcome center
The first impression zone. This is where prospective students, donors, visiting researchers, and the general public form their initial perception of the university:
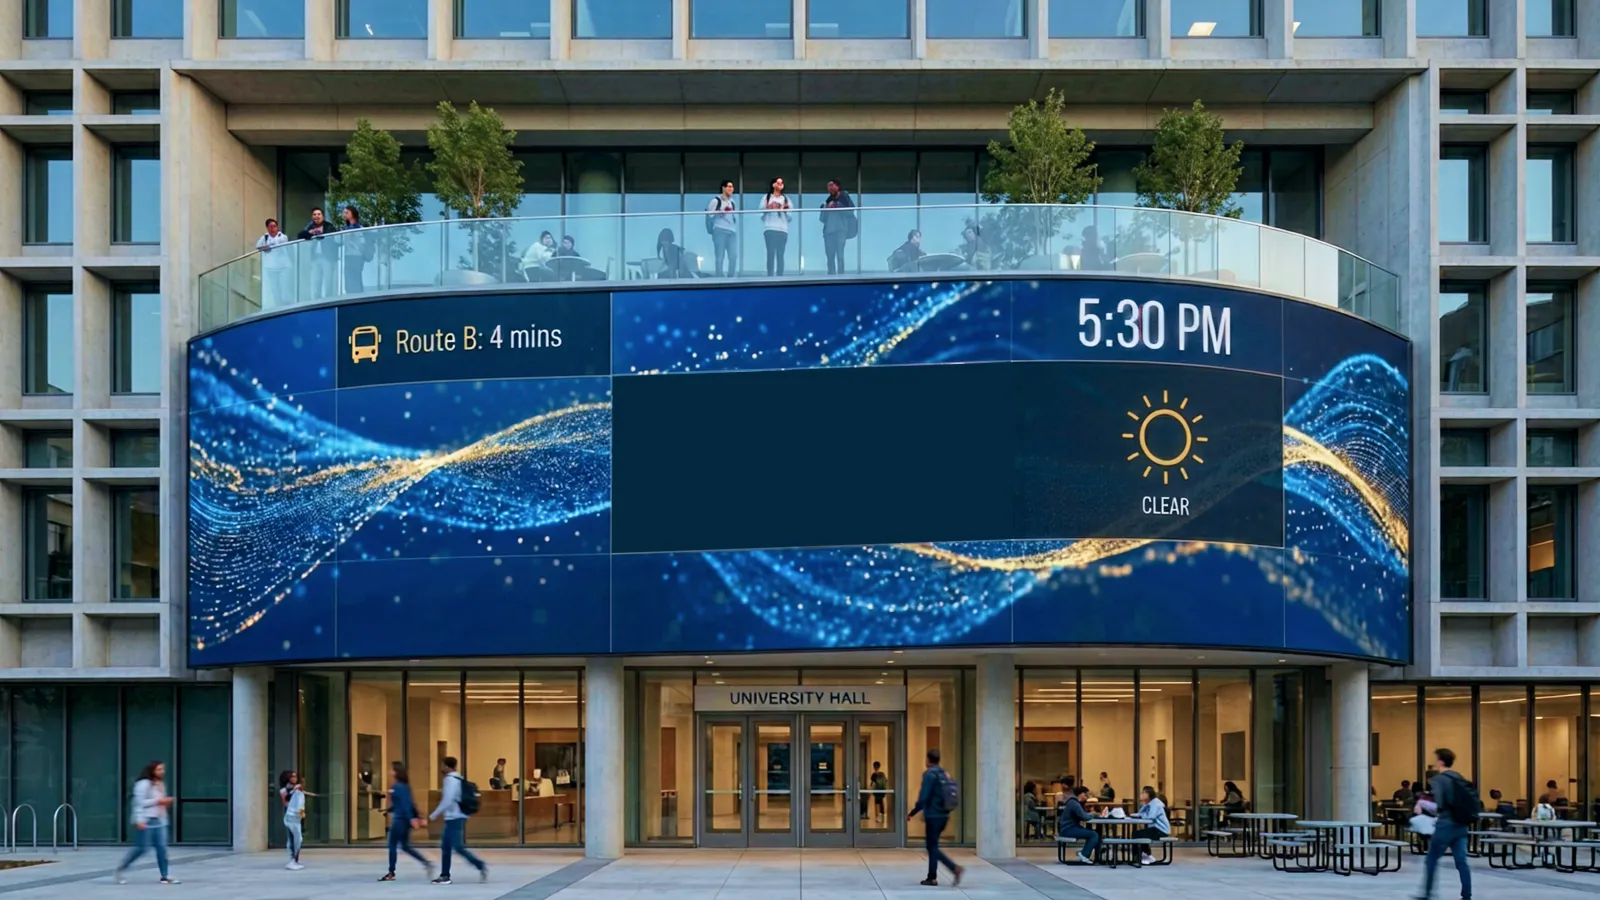
- Data-driven welcome displays that show live campus activity, enrollment statistics, or research milestones
- Interactive timelines tracing the university's history and impact
- Generative art installations that set the tone for the campus experience
3-2. Admissions and visitor center
The conversion zone. Every element here should support the tour-to-application pipeline:
- Immersive orientation rooms that transport visitors into campus life through projection mapping or LED environments
- Interactive program explorers that let prospective students browse majors, outcomes, and student stories by touch
- Personalized content delivery that adapts based on the visitor's expressed interests
3-3. University museum and gallery
Many universities maintain museums that serve both academic and public engagement missions:
- Interactive exhibits that complement physical collections with digital context
- Rotating digital installations by faculty, students, or visiting artists
- Touchscreen deep-dives that let visitors explore objects, provenance, and related research
3-4. Research buildings and innovation hubs
Where the university's intellectual output becomes tangible:
- Real-time research data visualizations (telescope feeds, climate models, genomic data, particle physics simulations)
- Interactive demonstrations of engineering projects, robotics, or computational research
- Innovation showcases that highlight startup activity, patents, and industry partnerships
3-5. Library and learning commons
The modern academic library is a technology-forward learning environment, not just a book repository:
- Digital media walls for student work showcases and community announcements
- Interactive archives and special collections interfaces
- Collaborative visualization spaces where students can work with data at scale
3-6. Student union and campus commons
The social heart of campus, where installations serve current students:
- Generative art walls that respond to movement, sound, or social media activity
- Event information systems with interactive calendars and wayfinding
- Student-created digital installations (particularly valuable for art, design, and CS programs)
3-7. Donor recognition wall and alumni hall
Where institutional gratitude meets cultivation:
- Interactive donor walls with searchable databases, impact visualizations, and giving history timelines
- Campaign progress displays with real-time fundraising data
- Alumni achievement showcases with multimedia profiles and career trajectories
4. Five Outcomes That Matter
4-1. Enrollment conversion: campus visit to application
This is the headline metric for admissions-focused installations. Universities with immersive admissions center experiences report 15–25% improvement in tour-to-application conversion rates. The mechanism is straightforward: an emotionally resonant campus visit creates stronger intent to apply.
The effect compounds. Higher application rates mean a larger applicant pool, which improves selectivity metrics, which improves rankings, which drives more applications. For institutions on the wrong side of the enrollment cliff, this positive cycle can be the difference between growing and contracting.
Interactive installations in admissions centers work because they show rather than tell. Instead of hearing about cutting-edge research, a prospective student interacts with a visualization of it. Instead of reading about campus diversity, they see real-time data on the wall. The experience is the proof point.
4-2. Donor engagement and gift size
Interactive donor walls don't just recognize past giving -- they influence future giving. When donors see their name alongside the impact of their contribution (scholarship recipients graduated, research breakthroughs funded, buildings completed), it reinforces the emotional connection that drives the next gift.
For capital campaigns specifically, interactive campaign progress walls create social proof and urgency. Seeing the thermometer move in real time, seeing peer donors' names appear, and visualizing what the completed project will look like -- these elements drive participation in ways that a letter from the president's office cannot.
Advancement offices report that interactive recognition environments correlate with higher average gift sizes and improved donor retention rates, particularly among younger alumni who expect digital-forward engagement.
4-3. Research funding visibility
NSF, NIH, and DOE grant applications increasingly require a broader impacts narrative. How will this research reach beyond the lab? Interactive installations that visualize research output provide a concrete, photographable, documentable answer.
A department with an interactive installation showcasing its research can:
- Include it in grant proposals as evidence of public engagement infrastructure
- Host site visits from program officers in an environment that communicates impact
- Generate media coverage that reinforces the university's research brand
- Attract prospective graduate students who see the work made tangible
4-4. Student satisfaction and retention
Retention is enrollment's quieter counterpart. Every student who leaves before graduating represents lost tuition revenue and a negative data point for institutional metrics. Campus environment quality correlates directly with student satisfaction, and satisfaction correlates with retention.
Interactive installations in student-facing spaces -- commons areas, libraries, recreation centers -- signal that the university invests in the student experience beyond the classroom. They also create informal gathering points and conversation starters that build the social connections known to improve retention.
4-5. International student recruitment
International students represent a significant revenue stream for many universities (often paying full tuition) and a substantial enrollment growth opportunity. But they face a unique barrier: most cannot visit campus before committing.
Immersive virtual campus experiences -- whether delivered through web-based 3D tours, AR overlays on printed materials, or VR previews at international recruitment fairs -- reduce the friction of committing to a university thousands of miles away. Universities that invest in these tools have a structural advantage in international recruitment.
5. Real University Examples
5-1. Bloomberg Center, Cornell Tech (New York)
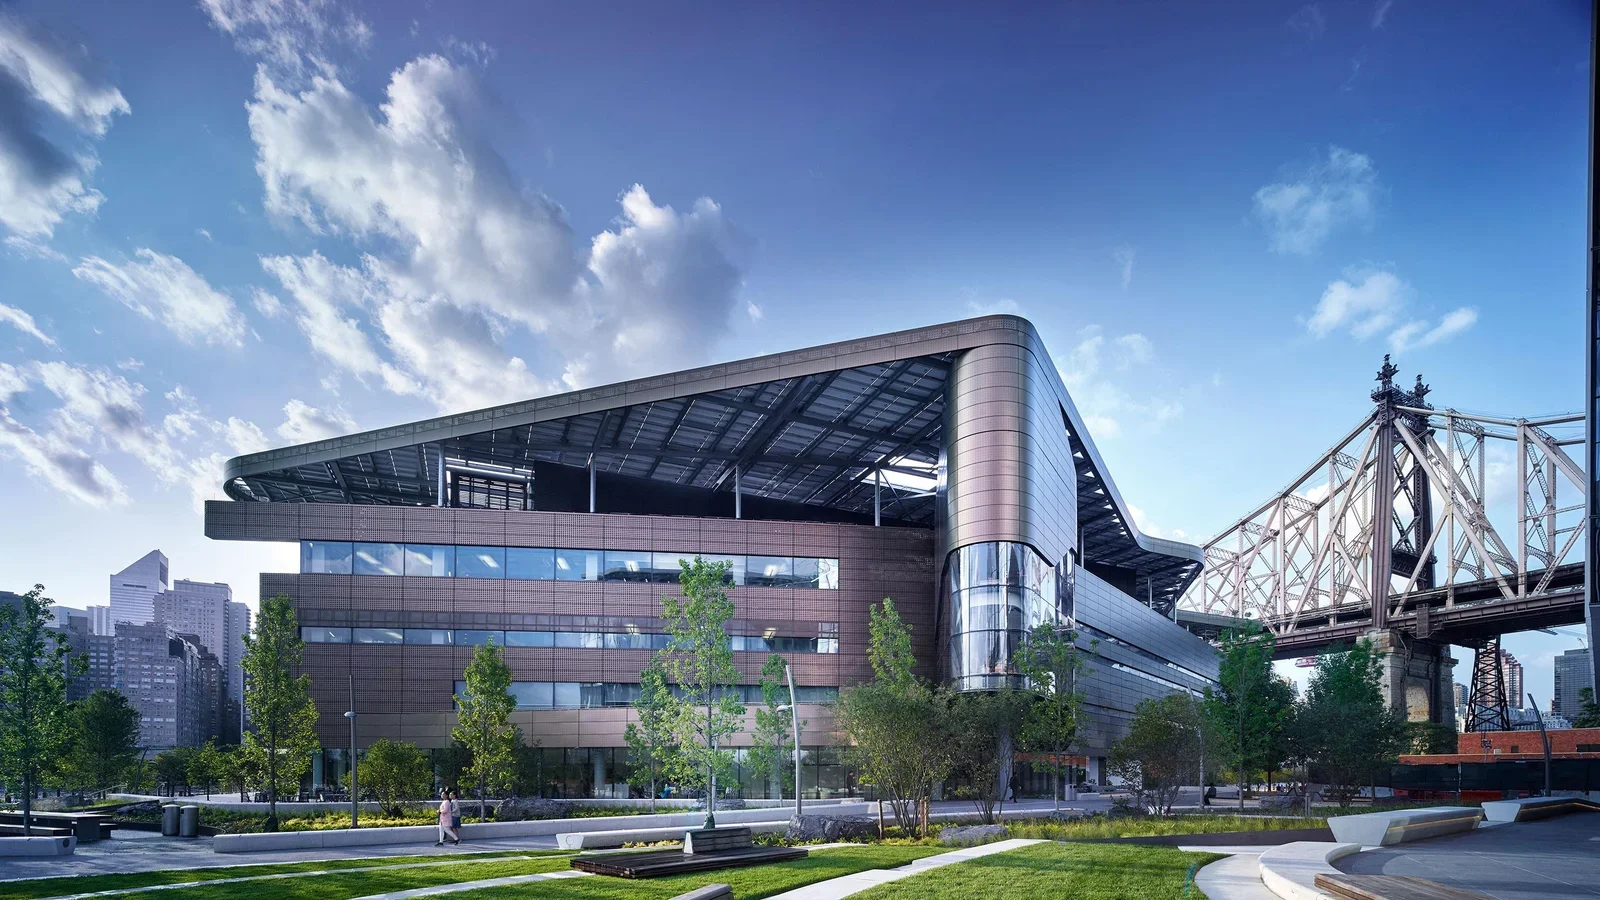
The Bloomberg Center on Cornell Tech's Roosevelt Island campus features an interactive community visualization wall designed by Local Projects. The installation displays real-time data about campus activity, research output, and community connections -- making the building's ecosystem visible to visitors and residents alike. The wall serves as both a donor recognition piece (the building bears the Bloomberg name) and a dynamic showcase of the campus's interdisciplinary mission.
Technology: Custom touch displays, real-time data feeds, generative visualization Studio: Local Projects Budget tier: $150K–$300K (estimated)
5-2. MIT Media Lab (Cambridge, MA)
The MIT Media Lab is itself an installation -- its transparent, open-plan architecture makes research visible from every angle. Digital displays throughout the building showcase active research projects, and interactive demonstrations are embedded in common areas. The Lab's lobby installations rotate regularly, featuring work from research groups spanning tangible interfaces, affective computing, and synthetic biology.
Technology: Projection mapping, tangible interfaces, sensor-driven displays, custom hardware Budget tier: $150K–$300K+ (ongoing, multiple installations)
5-3. Arizona State University -- Immersive Admissions Experience (Tempe, AZ)
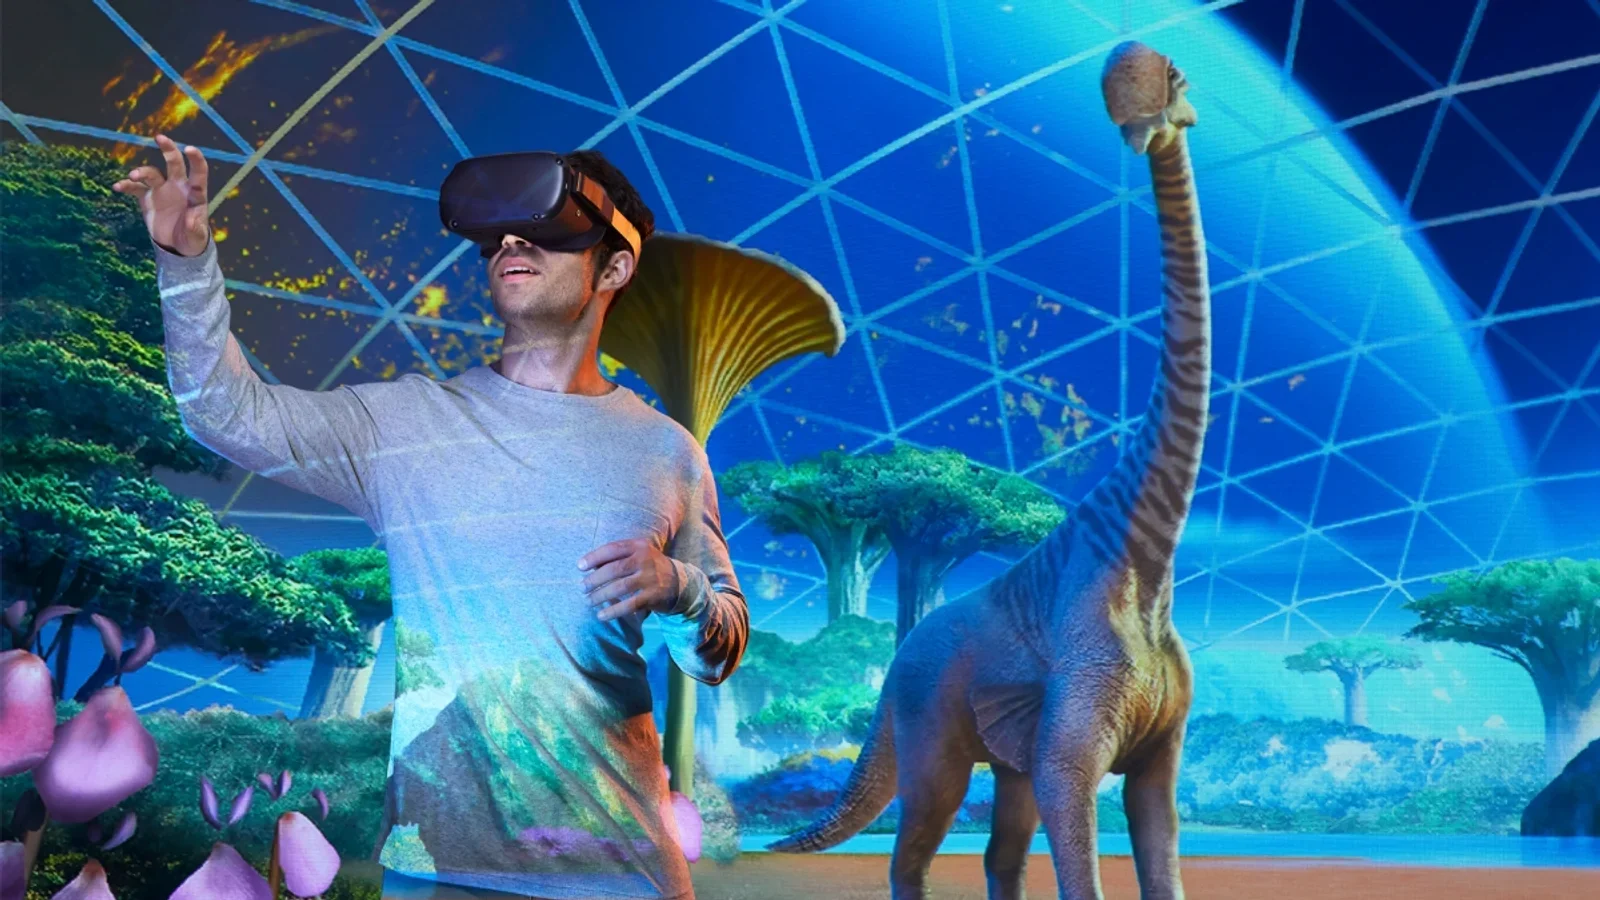
ASU has invested heavily in technology-forward campus experiences. Its partnership with Dreamscape Immersive deploys VR learning pods across STEM courses -- biology, chemistry, and physics students enter immersive simulations as part of their coursework. A longitudinal study found the VR labs boosted grades and retention in introductory STEM courses. The admissions center uses LED video walls, touchscreen kiosks, and data-driven content to walk prospects through programs and outcomes. ASU treats enrollment as a designed experience, not a slideshow.
Technology: VR immersive classrooms (Dreamscape), LED video walls, touchscreen kiosks Studio: Dreamscape Immersive (VR pods) Budget tier: $100K–$200K+ per deployment
5-4. Stanford d.school (Stanford, CA)
The Hasso Plattner Institute of Design at Stanford (d.school) uses its physical space as a prototyping canvas. Interactive installations are created by students and faculty as part of the design thinking curriculum, with the building itself serving as a testing ground for human-centered design. Modular walls, sensor-equipped rooms, and flexible digital surfaces make the space reconfigurable for different interactive experiments.
Technology: Modular sensor systems, projection, flexible display surfaces, IoT prototyping Budget tier: $50K–$150K (modular, student-driven)
5-5. Georgia Tech -- Clough Undergraduate Learning Commons (Atlanta, GA)
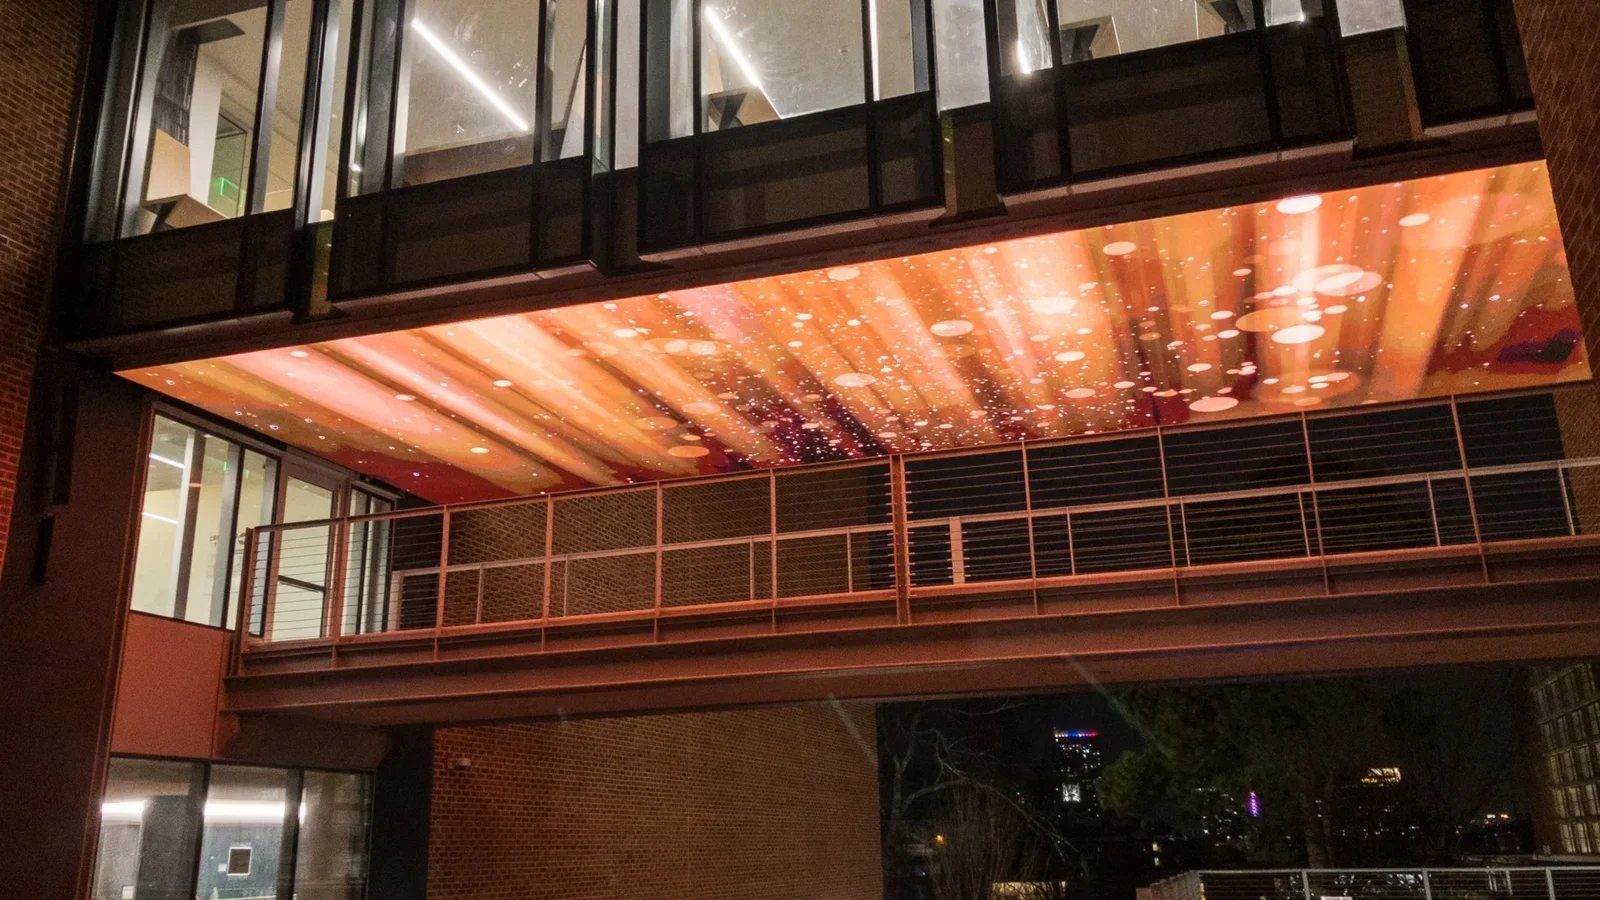
The Clough Undergraduate Learning Commons integrates interactive technology throughout a 220,000-square-foot facility that serves as the campus's primary study and collaboration hub. Digital media walls, interactive study room booking systems, and visualization spaces support both individual learning and group collaboration. The building's technology layer was designed to evolve with successive hardware and software upgrades.
Technology: Digital media walls, interactive booking systems, collaborative visualization displays Budget tier: $150K–$300K (technology layer within a larger building project)
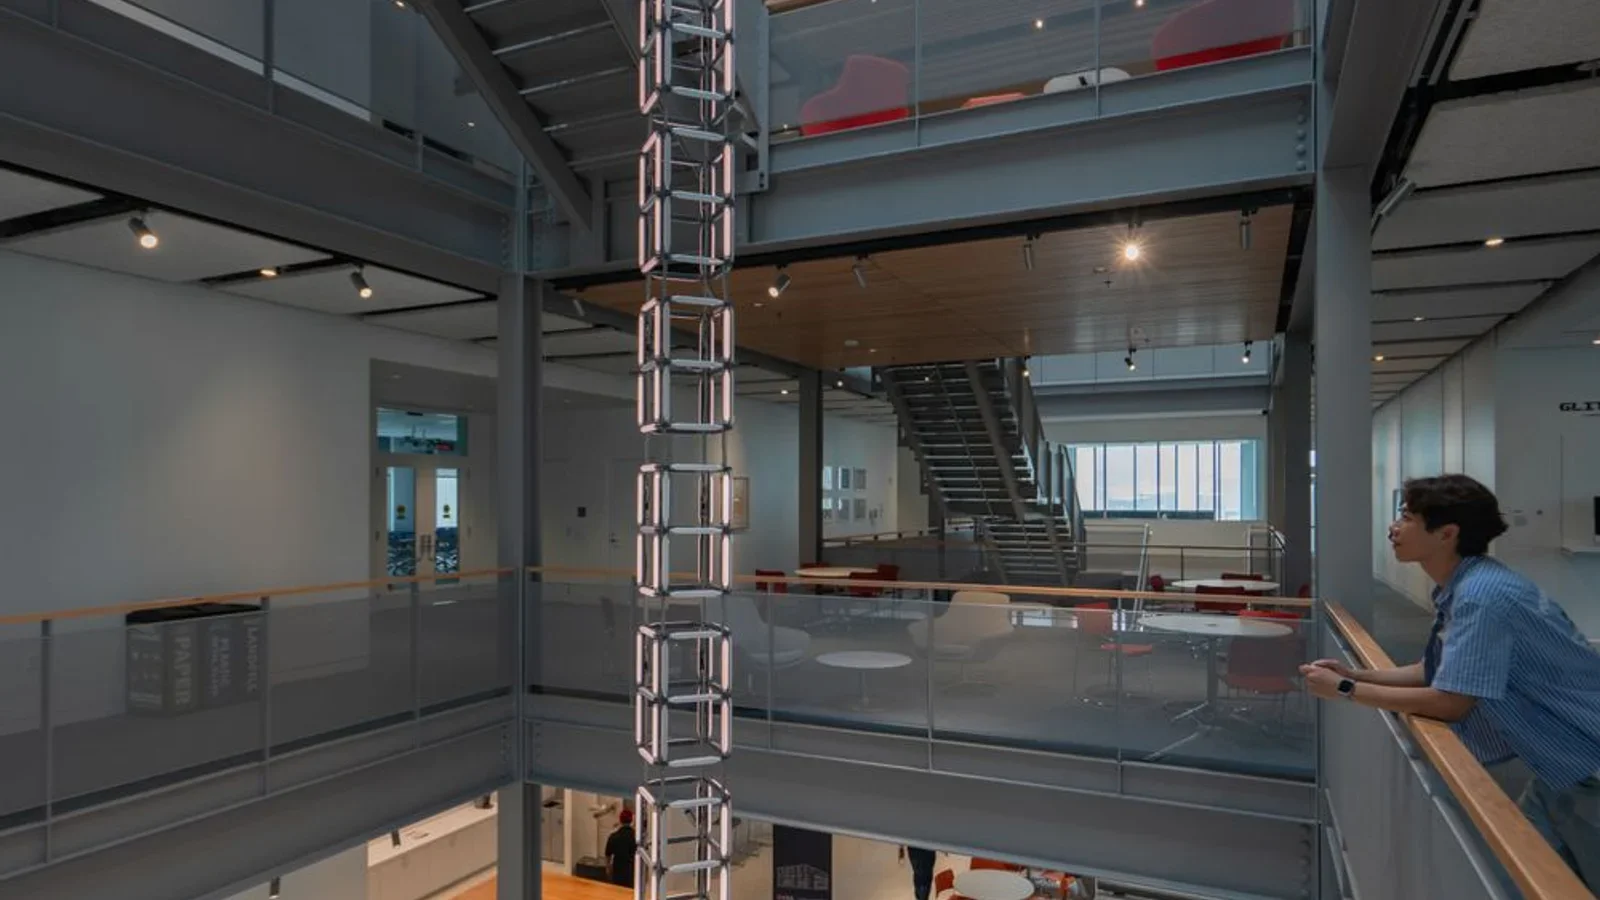
5-6. NYU -- Interactive Telecommunications Program (New York)
NYU's ITP (Interactive Telecommunications Program) produces interactive installations as part of its core curriculum. Student work regularly appears in the program's floor at 370 Jay Street, with installations ranging from kinetic sculptures to real-time data visualizations to full-room immersive experiences. ITP's annual winter show functions as both an exhibition and a recruiting tool for the program.
Technology: Custom hardware, Arduino/Raspberry Pi, projection, motion tracking, generative software Budget tier: $30K–$100K (distributed across student projects)
5-7. University of Michigan -- Museum of Natural History (Ann Arbor, MI)
The University of Michigan Museum of Natural History reopened in a renovated space with interactive exhibits throughout. Touchscreen deep-dives, motion-activated displays, and hands-on specimen exploration tools make the museum a draw for prospective students, K-12 field trips, and the Ann Arbor community. The museum serves dual admissions and community engagement goals.
Technology: Touchscreens, motion sensors, interactive specimen displays, digital media Budget tier: $200K–$400K (interactive exhibit layer)
5-8. Northeastern University -- Immersive Media Lab (Boston, MA)
Northeastern's immersive media research lab develops and showcases interactive installations that span VR, AR, spatial computing, and real-time visualization. Installations from the lab appear in campus common areas and serve as recruitment tools for the computer science and digital media programs. The lab demonstrates how research output can double as campus experience infrastructure.
Technology: VR/AR, spatial computing, real-time 3D, motion capture Budget tier: $100K–$250K (lab infrastructure with campus-facing outputs)
5-9. Harvard -- Undergraduate Admissions Center (Cambridge, MA)
Harvard's admissions process includes immersive orientation experiences designed to convey the breadth of the university's academic and residential life. Interactive displays in the admissions center allow prospective students to explore the house system, academic concentrations, and extracurricular landscape through touch-based interfaces and curated video content.
Technology: Touchscreen displays, curated interactive media, video walls Budget tier: $100K–$200K (estimated)
5-10. Drexel University -- URBN Center (Philadelphia, PA)
The URBN Center houses Drexel's design, media, and fashion programs in a converted industrial space. Interactive display surfaces throughout the building showcase student work, and flexible digital infrastructure supports rotating installations from different programs. The building itself is a recruiting statement for Drexel's creative programs.
Technology: LED displays, projection systems, flexible digital infrastructure Budget tier: $50K–$150K (integrated into building renovation)
5-11. USC Viterbi School of Engineering (Los Angeles, CA)
The Viterbi School uses interactive STEM exhibits and engineering demonstrations in its public-facing spaces to communicate the school's research capabilities. Robotics displays, structural engineering simulations, and data visualization installations make the engineering curriculum tangible for prospective students and visiting industry partners.
Technology: Robotics displays, simulation interfaces, data visualization, interactive models Budget tier: $100K–$250K (distributed across departments)
5-12. RISD -- Digital+Media Program (Providence, RI)
The Rhode Island School of Design Digital+Media program produces installations that blur the boundary between art and technology. Student and faculty work appears in campus galleries and public spaces, with installations ranging from generative art to interactive sculpture to immersive environments. RISD's approach treats the campus as a gallery, which itself becomes a recruiting tool.
Technology: Generative art, custom software, projection mapping, interactive sculpture, sensor systems Budget tier: $30K–$100K (artist/student-driven projects)
5-13. University of Virginia -- School of Data Science Sculpture
The UVA School of Data Science features a 40-foot LED data sculpture designed by SoSo Limited and built by Hypersonic. Visitors select from real data sets -- climate, COVID trends, demographics -- and watch them rendered as real-time 3D visualizations. The installation makes data science tangible for prospective students and community visitors alike, turning an abstract discipline into a physical experience.
Technology: 40-ft LED sculpture, interactive data set selection, real-time visualization Studio: SoSo Limited (design), Hypersonic (build) Budget tier: $100K–$300K+
5-14. Elon University -- Digital Donor Recognition Wall (Moseley Center)
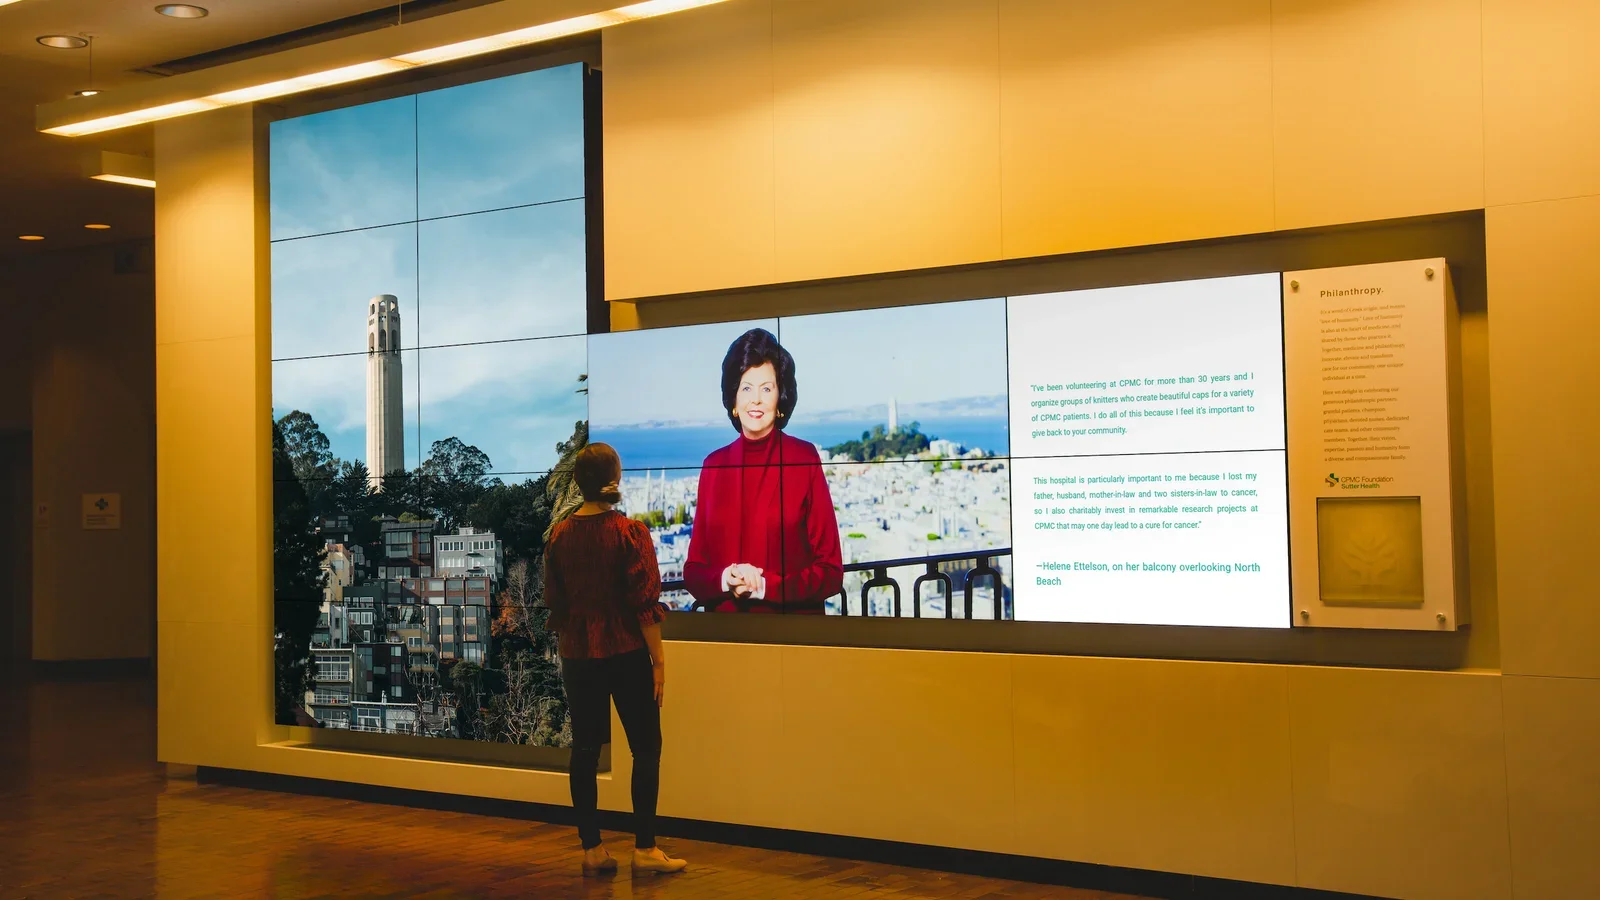
Elon University installed a 5-screen digital donor wall in the Moseley Center, designed by Presentation Design Group (PDG). The oak-framed display uses a separate tablet control panel and the Appellō CMS for on-demand videos and donor stories. During tours, it educates prospects on Elon's philanthropy culture and engages the university's 34,000+ active donors. The result: a +23% increase in annual fund participation after installation.
Technology: 5-screen digital wall, Appellō CMS, tablet control panel Studio: Presentation Design Group (PDG) Budget tier: $50K–$150K
5-15. Stanford CoDa Building -- "Fathom" Interactive Art (Stanford, CA)
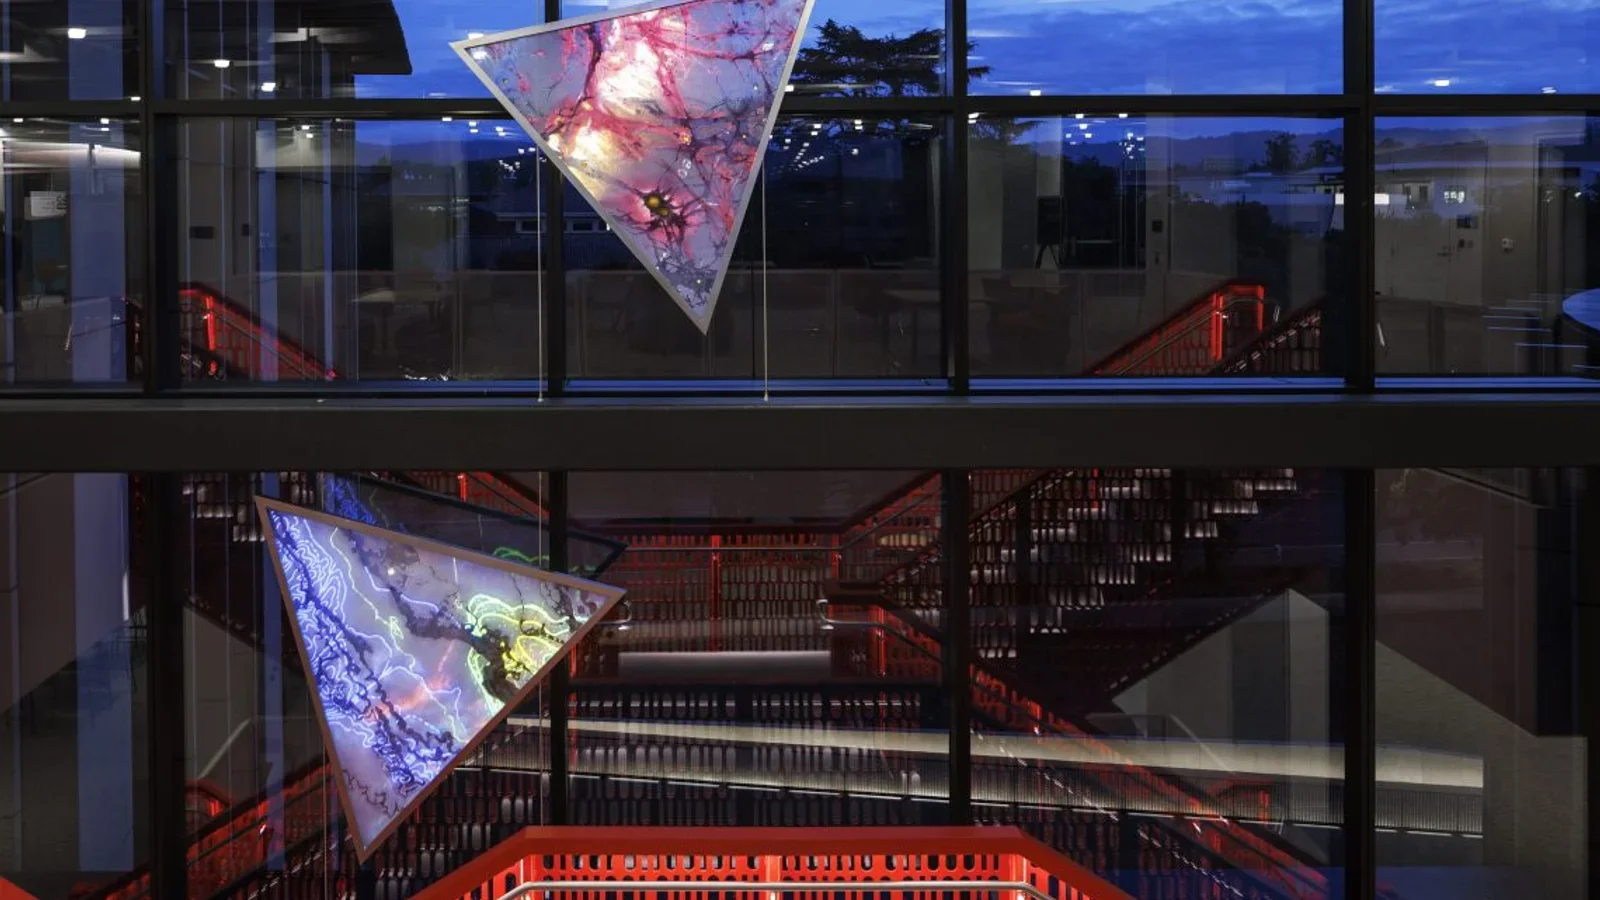
Artist Camille Utterback created "Fathom" for Stanford's new Computational and Data Science building -- interactive glass panels encoding the history of data and computation. The artwork responds to the presence of passersby, creating a dynamic relationship between the building's occupants and its visual identity. It demonstrates how research visualization can be embedded in architecture.
Technology: Interactive glass panels, presence sensing, computational design Studio: Camille Utterback Budget tier: $100K+ (permanent commission)
| University | Installation Type | Key Technology | Budget Tier |
|---|---|---|---|
| Cornell Tech | Community visualization wall | Data viz, touch displays | $150K–$300K |
| MIT Media Lab | Research showcases | Projection, tangible interfaces | $150K–$300K+ |
| Arizona State | Dreamscape VR + admissions | VR pods, LED walls, touchscreens | $100K–$200K+ |
| Stanford d.school | Prototyping canvas | Modular sensors, IoT | $50K–$150K |
| Georgia Tech | Learning commons tech layer | Media walls, collaborative viz | $150K–$300K |
| NYU ITP | Student-created installations | Custom hardware, generative | $30K–$100K |
| U Michigan | Museum interactive exhibits | Touch, motion, specimen displays | $200K–$400K |
| Northeastern | Immersive media showcases | VR/AR, spatial computing | $100K–$250K |
| Harvard | Admissions center displays | Touch interfaces, video walls | $100K–$200K |
| Drexel URBN | Student work showcases | LED, projection, flexible digital | $50K–$150K |
| USC Viterbi | STEM engagement exhibits | Robotics, simulation, data viz | $100K–$250K |
| RISD Digital+Media | Art-technology installations | Generative art, projection | $30K–$100K |
| UVA Data Science | LED data sculpture | Real-time data viz, LED | $100K–$300K+ |
| Elon University | Digital donor wall | 5-screen display, CMS | $50K–$150K |
| Stanford CoDa | Interactive glass art | Presence sensing, computational | $100K+ |
6. Technology Categories
6-1. LED and projection (large-format immersive)
Large-format visual technology creates the "wow moment" -- the first impression that shapes perception of the entire campus:
- LED video walls: High-brightness, long-life displays for admissions centers, atriums, and donor recognition spaces. Budget $800–$2,500 per square foot depending on pixel pitch and mounting complexity.
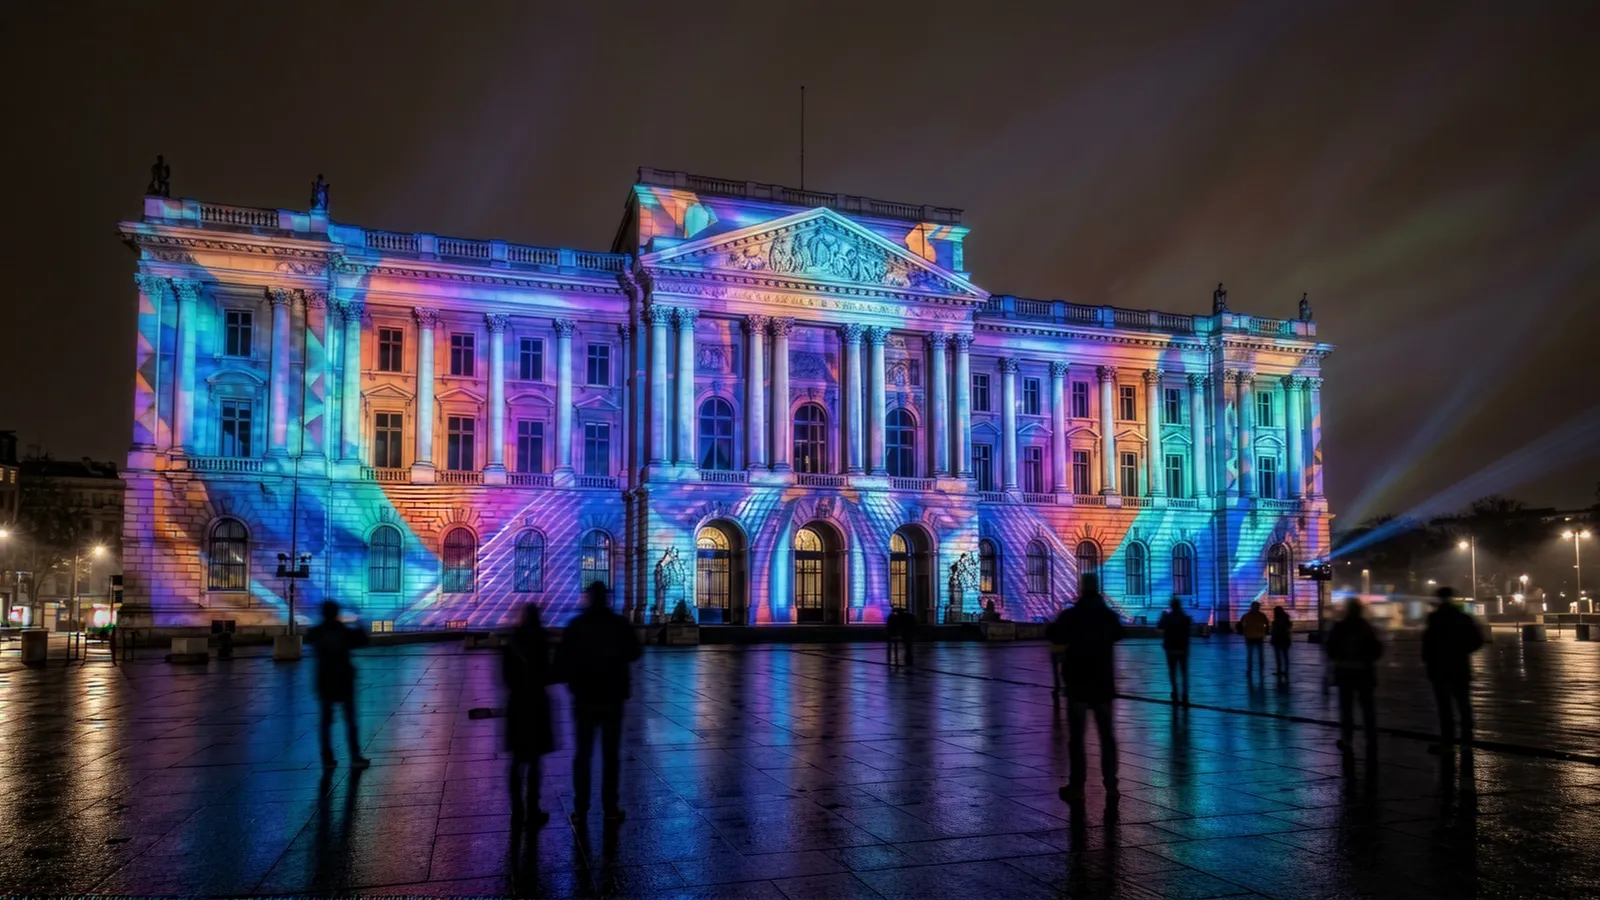
- Projection mapping: Transforms existing architecture into dynamic surfaces. Lower hardware cost than LED but requires controlled lighting and more frequent lamp/laser replacement. Effective for event-based activations and temporary installations.
- Transparent LED: Overlay digital content on glass facades without blocking natural light. Emerging technology with premium pricing but strong aesthetic results in modern campus buildings.
For universities, LED is typically the better long-term investment for permanent installations due to lower maintenance and longer lifespan. Projection works well for flexible spaces and event-driven use cases.
6-2. Touch and data visualization (interactive kiosks, donor walls)
The workhorse of campus installations -- reliable, intuitive, and ADA-compliant:
- Touchscreen kiosks: Wayfinding, program exploration, and visitor orientation. Budget $5K–$25K per unit depending on size and custom software.
- Interactive donor walls: Multi-touch surfaces with custom databases connecting donors to impact. Budget $50K–$200K for a comprehensive donor recognition system.
- Data dashboards: Real-time institutional data (enrollment, research output, sustainability metrics) displayed on large-format interactive screens.
Touch interfaces are the most accessible and maintainable option for most campus applications. They require minimal training, work for all age groups, and have well-established accessibility patterns.
6-3. AR and MR (campus tours, research overlay)
Augmented reality layers digital content over the physical campus:
- Mobile AR tours: Prospective students point their phones at buildings, sculptures, or landmarks to access contextual content -- video, 3D models, and historical overlays.
- Research AR: Point a device at a lab entrance to see a visualization of the research happening inside.
- Construction preview: During building campaigns, AR can show donors and stakeholders what a completed building will look like on site.
AR requires no permanent hardware installation, making it the lowest-infrastructure option. It does require app development or web-based AR frameworks and consistent content updates.
6-4. Generative art and real-time computation
Installations driven by algorithms, data feeds, and real-time inputs:
- Generative art walls: Software-driven visual compositions that never repeat, responding to time, weather, campus data, or visitor presence.
- Real-time data art: Campus energy usage, library foot traffic, or social media sentiment visualized as evolving artwork.
- AI-driven compositions: Machine learning models trained on institutional data creating unique visual outputs.
Generative installations are particularly effective in universities because they naturally connect to computer science, art, and design curricula. Students and faculty can contribute to the content pipeline, making the installation a living part of the academic program.
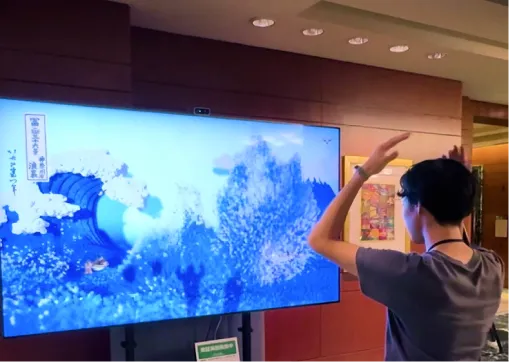
6-5. Body tracking and gesture
Sensor-based installations that respond to physical presence and movement:
- Depth cameras: Track visitor position and gestures to trigger visual responses on walls or floors.
- Motion-reactive environments: Lobbies and corridors that respond to foot traffic patterns with light, sound, or visual changes.
- Gesture-controlled interfaces: Large-screen displays controlled by hand movements, useful in settings where touch is impractical (high-traffic areas, sterile environments).
Body tracking creates the most dramatic visitor reactions -- people are genuinely surprised when a wall responds to their movement. This makes it especially effective in admissions environments where you want to create memorable moments. Sound design is an important consideration here, as audio feedback significantly enhances the impact of gesture-driven installations.
6-6. Research data integration (API, IoT, live feeds)
Connecting campus installations to live institutional data:
- API integrations: Pull real-time data from campus systems (enrollment, research databases, energy management, library systems) into visual displays.
- IoT sensor networks: Environmental sensors, weather stations, seismic monitors, and building systems feeding data to public-facing installations.
- Observatory and lab feeds: Telescope imagery, microscope feeds, or experimental data streams visualized in real time for public engagement.
This category is unique to universities because they generate enormous volumes of interesting data as a byproduct of their core mission. The installation doesn't need to create content -- it needs to make existing data visible.
7. Budget Tiers & Timeline
7-1. $30K–$50K -- Pilot / single-room
What you get:
- A single interactive touchpoint: one donor kiosk, one interactive display, or one small-scale generative installation
- Custom software development for a defined use case
- Standard hardware with 1-year warranty
- Basic CMS for content updates
Timeline: 4–8 weeks from concept to launch
Best for: Testing the concept in one high-visibility location. A single interactive kiosk in the admissions center or a small donor wall in an alumni building. Proof of concept before committing to larger investment.
7-2. $50K–$150K -- Admissions center / entrance feature
What you get:
- A signature installation: an interactive donor wall, an immersive admissions room, or a multi-screen research showcase
- Custom content design and development
- Integration with one institutional data source (donor database, enrollment system, research feeds)
- Professional installation and calibration
- 1-year support and maintenance
Timeline: 8–16 weeks from concept to launch
Best for: The flagship installation that anchors a campus space. An admissions center experience, a donor recognition wall for a capital campaign, or an interactive research showcase in a new building.
7-3. $150K–$300K -- Multi-zone campus experience
What you get:
- 3–6 connected installation zones across multiple campus buildings
- Unified design language and content management system
- Multiple data source integrations (donor database, research systems, campus APIs)
- Body tracking, gesture, or AR components alongside touch interfaces
- Remote monitoring and analytics dashboard
- 2-year support plan
Timeline: 16–24 weeks from concept to launch
Best for: A comprehensive campus experience strategy spanning admissions, donor recognition, and student engagement across multiple buildings. Often tied to a capital campaign or strategic plan.
7-4. $300K+ -- Flagship campus transformation
What you get:
- Campus-wide interactive infrastructure (6+ zones)
- Custom hardware design and fabrication for signature moments
- Full integration with institutional systems (CRM, donor databases, research repositories, campus IoT)
- AR campus tour layer
- Dedicated content pipeline with seasonal refresh schedule
- 3–5 year support and evolution plan
Timeline: 6–12 months, typically phased across academic calendar breaks
Best for: New building openings, major campus renovations, comprehensive enrollment strategy overhauls, or flagship capital campaigns.
7-5. Running costs (10–15% annually)
Budget for these recurring expenses:
- Content refresh: 10–15% of initial content cost per year (essential for admissions content that must reflect current programs and outcomes)
- Hardware maintenance: LED panels, touch surfaces, and sensors need periodic replacement and calibration
- Software licensing: CMS, analytics, and monitoring platforms ($1K–$5K/month depending on scale)
- Data integration maintenance: Campus API changes, database updates, and feed management
For a detailed breakdown of installation costs across all venue types, see our interactive installation cost and budget guide.
| Tier | Budget | Typical Use | Timeline | Example |
|---|---|---|---|---|
| Pilot | $30K–$50K | Single kiosk or small display | 4–8 weeks | Admissions kiosk, small donor display |
| Feature | $50K–$150K | Signature room or wall | 8–16 weeks | Interactive donor wall, immersive admissions room |
| Multi-zone | $150K–$300K | 3–6 connected zones | 16–24 weeks | Admissions + donor + research showcases |
| Flagship | $300K+ | Campus-wide transformation | 6–12 months | New building launch, comprehensive campus upgrade |
8. Funding Sources
University installations benefit from funding sources unavailable to commercial venues. Understanding these options can significantly offset costs.
Federal grants:
- NSF (National Science Foundation): Broader impacts funding, especially for STEM visualization and public engagement installations. Programs like NSF's Advancing Informal STEM Learning (AISL) directly fund interactive exhibits.
- NEA (National Endowment for the Arts): Grants for installations with artistic merit, particularly relevant for campus gallery and public art projects.
- NEH (National Endowment for the Humanities): Digital humanities projects, interactive archives, and cultural heritage installations.
- Title III / Title V: Federal funding for Minority-Serving Institutions (MSIs) that can cover technology infrastructure upgrades including interactive campus installations.
Private foundation grants:
- Foundations focused on education, STEM engagement, or arts education regularly fund campus installation projects. The Kresge Foundation, Andrew W. Mellon Foundation, and Gordon and Betty Moore Foundation have all funded interactive campus environments.
Alumni campaigns with naming rights:
- Interactive installations can be named for donors, combining recognition with engagement. A "$100K Interactive Donor Wall" can be partially funded by the donor whose name it bears -- the installation itself becomes a giving incentive.
Industry partnerships:
- Technology companies (Intel, Google, Microsoft, NVIDIA) fund campus technology showcases that also serve as brand presence. These partnerships can offset 30–50% of installation costs in exchange for branding and case study rights.
Capital campaigns:
- Interactive installations are increasingly included as line items in capital campaigns for new buildings. The marginal cost of including interactive technology during new construction is significantly lower than retrofitting later.
9. Common Pitfalls
Building for spectacle instead of strategy. A beautiful installation that doesn't connect to an institutional goal (enrollment, donor engagement, research visibility) becomes an expensive screen saver. Every installation should have a measurable outcome attached before design begins. The framework in our studio briefing guide helps define those goals.
Ignoring accessibility from the start. Campus installations must comply with ADA requirements and ideally meet WCAG 2.1 AA standards. Touch interfaces need to be reachable from a wheelchair. Visual content needs sufficient contrast. Audio components need captions or alternatives. Retrofitting accessibility is far more expensive than designing for it. See our guide on accessible installations for detailed requirements.
No content refresh plan. An admissions center installation showing 2024 graduation data in 2026 undermines rather than supports the university's message. Budget and plan for annual content updates tied to the academic calendar -- new enrollment data, new research highlights, new student stories. Content refresh isn't optional; it's the difference between a living installation and a dated one.
Procurement process delays. University procurement moves slowly. RFP requirements, committee reviews, vendor vetting, and multi-stage approvals can add 3–6 months to a project timeline. Start the procurement process well before you need the installation operational. If targeting a fall semester unveiling, begin RFP processes by the previous fall.
Not aligning with the academic calendar. Installation work during move-in week, finals, or commencement is disruptive and often prohibited. Plan physical installation during summer break or winter recess. Back-plan your timeline from the desired launch date, accounting for campus access restrictions.
Siloed department ownership. When admissions, advancement, facilities, and IT each own different aspects of the project without coordination, the result is disjointed. Assign a single project lead with authority to coordinate across departments. This person should have direct access to the provost or VP level for decision escalation.
Vendor lock-in on content. If only the original vendor can update your installation's content, you're locked into their pricing and availability for the installation's entire lifespan. Require open content management systems, documented APIs, and the ability to update content in-house or through any qualified vendor. Our guide on choosing a studio covers this in detail.
10. Roadmap: From Concept to Launch
The timeline below assumes a mid-range installation ($50K–$150K) targeting a fall semester launch. Scale up for larger projects, and adjust dates based on your institution's academic calendar and procurement requirements.
| Phase | Timeline | Activities | Key Stakeholders |
|---|---|---|---|
| 1. Discovery & scoping | Weeks 1–2 | Define goals, identify campus zones, establish budget, form project team | Provost/VP, admissions, advancement, facilities |
| 2. Procurement & vendor selection | Weeks 3–6 | Draft RFP, solicit proposals, evaluate studios, select partner | Procurement, project lead, selection committee |
| 3. Concept design | Weeks 7–10 | Design exploration, content strategy, technical architecture, accessibility plan | Studio, project lead, department stakeholders |
| 4. Design approval | Weeks 11–12 | Stakeholder presentations, revisions, final design sign-off | Committee, facilities, IT |
| 5. Content development | Weeks 13–18 | Content creation, data integration development, software build, user testing | Studio, content owners, IT |
| 6. Hardware & fabrication | Weeks 14–18 | Hardware procurement, custom fabrication, shipping (overlaps with content) | Studio, facilities |
| 7. Installation & calibration | Weeks 19–20 | Physical installation, hardware integration, calibration, testing | Studio, facilities, IT |
| 8. Testing & training | Weeks 21–22 | Full system testing, staff training, content management handoff | Studio, operations team |
| 9. Soft launch | Week 23 | Quiet launch with internal audience, gather feedback, adjust | Project team, select users |
| 10. Public launch | Week 24 | Public unveiling, media coverage, stakeholder event | Communications, leadership |
Critical path considerations:
- Summer installation window: For most universities, the 10–12 weeks between spring commencement and fall move-in are the optimal installation window. Back-plan accordingly.
- Procurement lead time: University RFP processes often require 4–8 weeks. Start procurement in the fall semester for a summer installation.
- Content dependencies: Admissions content should reflect the most current data. Plan content finalization for the latest possible date before launch.
- IT coordination: Network infrastructure, power, and data connections require facilities and IT coordination. Engage these teams at project kickoff, not during installation.
11. About Utsubo
Utsubo is a creative studio specializing in interactive installations and immersive web experiences. Based in Osaka with a global client base, we bring together spatial design, real-time 3D technology, and experience strategy.
We work at the intersection of physical installations and digital experiences -- creating environments that respond, adapt, and engage.
We've worked across museums, corporate offices, libraries, and cultural venues. The principles are consistent: understand the audience, define the outcome, design the experience, build it to last.
12. Let's Talk
Building something ambitious for your campus? We work with universities on interactive experiences, research visualization, and immersive enrollment environments.
If you're exploring a partnership, let's discuss your project:
- What you're building and the constraints you're working with
- Which technical approach makes sense for your goals
- Whether we're the right fit to help you execute
University Installation Checklist
- Defined primary use case (enrollment, donor recognition, research visibility, wayfinding, student experience)
- Identified campus zone and physical constraints (power, network, lighting, foot traffic)
- Confirmed budget tier and funding source (grants, capital campaign, industry partnership, operating budget)
- Mapped stakeholder approval chain (provost, facilities, IT, procurement, department heads)
- Aligned timeline with academic calendar (summer installation window, fall launch target)
- Drafted accessibility requirements (ADA compliance, WCAG 2.1 AA minimum)
- Identified 2–3 studios for RFP and begun procurement process
- Planned content refresh cycle (annual data updates, seasonal stories, program changes)
- Set success metrics and measurement plan (conversion rate, engagement time, donor retention, UGC volume)
FAQs
How much does a university interactive installation cost?
Budget tiers range from $30K–$50K for a single-room pilot (one kiosk or small display), $50K–$150K for a signature installation like an interactive donor wall or immersive admissions room, $150K–$300K for a multi-zone campus experience spanning 3–6 connected installations, and $300K+ for a flagship campus transformation with 6+ zones and campus-wide integration. Running costs are typically 10–15% of the initial investment annually for content refresh, maintenance, and software. For a complete cost breakdown, see our interactive installation cost guide.
What ROI can universities expect from interactive installations?
The most measurable ROI comes from admissions: universities with immersive admissions center experiences report 15–25% improvement in tour-to-application conversion rates. For advancement, interactive donor walls correlate with higher average gift sizes and improved donor retention, particularly among younger alumni. Research-focused installations strengthen NSF broader impacts narratives and can support higher grant funding rates. Student-facing installations contribute to satisfaction and retention metrics. The key is defining measurable goals before design begins -- enrollment conversion, donor engagement, research visibility, or student satisfaction -- and building the measurement framework into the project plan.
What are the most common types of university installations?
The most common formats are interactive donor walls (touch-enabled recognition displays with giving history and impact visualization), admissions center experiences (immersive rooms with LED walls, data visualizations, and interactive program explorers), STEM engagement exhibits (hands-on installations in science buildings), digital wayfinding systems (touch and gesture-based campus navigation), research visualization displays (real-time data from labs and sensors), student commons installations (generative art and social displays), and alumni engagement platforms. Most universities start with either an admissions or donor-focused installation because these have the most direct ROI connection.
How long does it take to install interactive technology on campus?
A single-room pilot takes 4–8 weeks from concept to launch. A signature installation like an interactive donor wall or immersive admissions room requires 8–16 weeks. Multi-zone campus experiences spanning 3–6 connected zones need 16–24 weeks. Flagship campus transformations run 6–12 months, typically phased across academic calendar breaks. Add 4–8 weeks for university procurement processes (RFP, committee review, vendor selection). The critical constraint is the summer installation window -- most universities have only 10–12 weeks between spring commencement and fall move-in for physical installation work.
What funding sources are available for campus installations?
Universities have access to funding sources unavailable to commercial venues. Federal grants include NSF (broader impacts and AISL programs), NEA (artistic merit), NEH (digital humanities), and Title III/V for Minority-Serving Institutions. Private foundations like Kresge, Mellon, and Moore fund interactive campus environments. Alumni campaigns with naming rights can partially fund installations through donor recognition. Industry partnerships with technology companies can offset 30–50% of costs. Capital campaigns for new buildings should include interactive technology as a line item -- the marginal cost during new construction is significantly lower than retrofitting.
Can interactive installations work for both recruitment and donor engagement?
Yes, and the best campus installations serve multiple audiences through adaptable content. An installation in a building lobby can display admissions-focused content during tour hours and donor recognition content during advancement events -- same hardware, different content mode. Donor walls can include elements that showcase student outcomes, making them relevant to prospective families touring campus. The key is designing the content management system for multi-audience use from the start, not bolting on secondary audiences after launch. Many of the experience economy principles apply: the same infrastructure creates value for different stakeholder groups.
What accessibility requirements apply to campus installations?
Campus installations must comply with ADA (Americans with Disabilities Act) requirements. Best practice is WCAG 2.1 AA standards. This means touch interfaces must be reachable from a wheelchair (maximum 48 inches high for forward reach), visual content needs sufficient color contrast (4.5:1 minimum for text), interactive elements need alternatives for users who cannot see, hear, or physically interact with them, and all experiences should be operable without requiring fine motor skills. Audio components need visual alternatives or captions. Universities receiving federal funding have additional Section 508 compliance obligations. Design for accessibility from the start -- it's significantly less expensive than retrofitting. Our guide on accessible installations covers these requirements in detail.
How do universities measure the success of interactive installations?
Measurement depends on the installation's primary goal. For admissions: track tour-to-application conversion rates before and after installation, comparing cohorts who experienced the installation versus those who didn't. For donor engagement: measure dwell time at donor walls, correlation between wall interactions and subsequent giving, and donor retention rates. For research: count grant applications citing the installation in broader impacts sections, and media coverage generated. For student experience: survey satisfaction scores and correlate with retention data. Universal metrics include engagement time (how long visitors interact), completion rate (percentage who explore the full experience), and digital reach (social shares, photos posted). Install analytics from day one -- retroactive measurement is impossible.
 Osaka Interactive Installation Studio