The global attractions industry generated $83.6 billion in 2024, with the top 25 parks alone drawing over 260 million visitors. But here's the number that matters more: guests at parks with interactive queue experiences rate overall satisfaction 15--28% higher than guests at parks without them---even when wait times are identical.
Theme parks have always been in the experience business. What's changed is the technology available to fill the spaces between the rides. Interactive installations are transforming queues from dead time into pre-show engagement, turning legacy dark rides into mixed-reality spectacles, and extending the life of 20-year-old attractions through digital overlay---all without pouring new foundations. This is the experience economy at its most capital-intensive and its most rewarding.
This guide covers queue entertainment systems, dark ride interactive technology, and digital overlay for existing attractions---with real budgets ($500K--$10M+), timelines (12--36 months), and case studies from Universal, Disney, and the Japan market.
Who this is for: Theme park operators, VPs of creative development, directors of new attractions, show designers at experience design firms, and entertainment technology consultants evaluating interactive technology investments for parks and attractions.
Key Takeaways
- The global attractions market hit $83.6 billion in 2024, with interactive guest experiences becoming the primary differentiator between parks that grow and parks that plateau.
- Interactive queue entertainment reduces perceived wait times by 30--40%---and guests who engage with queue interactives spend 18--25% more on in-park merchandise and F&B.
- Budget tiers: $500K--$1M (single-zone queue overlay), $1--3M (multi-zone queue + pre-show), $3--10M (full dark ride tech package), $10M+ (ground-up attraction with integrated interactivity).
- Trackless ride systems + mixed reality represent the current state of the art---Mario Kart: Koopa's Challenge at USJ and Rise of the Resistance at Disney set the benchmark.
- Digital overlay can extend the commercial life of existing attractions by 5--10 years at 10--20% of full replacement cost.
- Content refresh is the recurring cost most operators underestimate: budget 15--25% of initial content investment annually to prevent staleness.
- Japan leads innovation: USJ's Super Nintendo World, TDR's Fantasy Springs (¥320 billion investment), and Expo 2025 technologies are setting global standards.
1. Why Static Queues and Legacy Rides Are Revenue Leaks
1-1. The wait time problem
The average guest at a major theme park spends 2--3 hours per day waiting in queues. At parks like Tokyo Disneyland, peak-day waits for flagship attractions regularly exceed 120 minutes. That's time guests aren't riding, shopping, eating, or having the kind of experience that builds loyalty and drives return visits.
Research on wait perception---including work by Disney and Stanford---shows that occupied waits feel 30--40% shorter than unoccupied waits. An interactive queue doesn't reduce the actual wait. It changes how that wait is experienced. And the downstream effects are measurable: higher satisfaction scores, higher per-cap spend, and higher intent to return.
1-2. The retrofit imperative
Building a new E-ticket attraction costs $200M--$500M+ and takes 4--7 years from concept to opening. Most parks can't afford to replace aging attractions at that pace. The alternative is digital retrofit: layering interactive technology onto existing infrastructure to deliver a fresh experience without rebuilding the ride system.
This is happening at every scale. Six Flags and Cedar Fair parks are adding projection mapping and interactive elements to queues for a fraction of new-build cost. Disney has refreshed attractions like Spaceship Earth and Haunted Mansion with digital scenic enhancements. The economics are compelling: $1--5M for a digital refresh vs. $200M+ for a replacement.
1-3. Generational expectations
Guests under 35 grew up with interactive screens, real-time feedback, and gamified experiences. A painted mural and a switchback queue rope don't create the kind of moment they want to photograph, share, and revisit. The expectations bar has been permanently raised by experiences like teamLab Borderless (4.2 million visitors annually), immersive dining concepts, and interactive pop-ups.
Parks that don't invest in interactive guest experiences will lose ground to parks---and non-park venues like stadiums and entertainment complexes---that do.
2. Queue Entertainment Technologies
Queue entertainment transforms the least-loved part of the theme park experience into an extension of the attraction narrative. The best implementations make guests forget they're waiting.
2-1. Projection mapping queues
Projection mapping turns queue walls, floors, and ceilings into dynamic scenic surfaces. Content can respond to time of day, crowd density, seasonal events, or story beats timed to queue progression.
The queue for Hagrid's Magical Creatures Motorbike Adventure at Universal Orlando set a new benchmark: guests move through Hagrid's hut, encounter magical creatures in illuminated terrariums, and interact with enchanted objects---all before reaching the ride vehicle. The queue experience is so well-regarded that some guests queue specifically for the walkthrough. Disney's Rise of the Resistance pre-show uses projection, practical effects, and live-size holographic characters to deliver a 15-minute narrative experience before the ride begins.
Hardware requirements: commercial-grade laser projectors (Christie, Barco, Panasonic) rated for 20,000+ hours, media servers (disguise, 7thSense), and show control systems (Alcorn McBride) for synchronized playback.
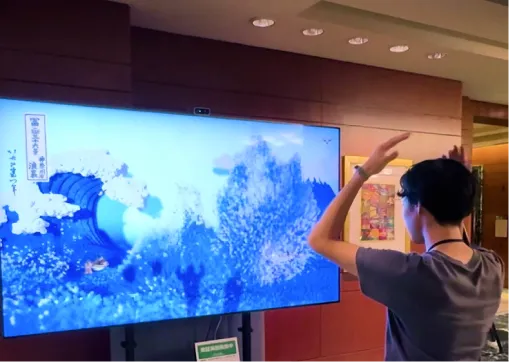
2-2. Interactive walls and gesture surfaces
Body-tracking and gesture-responsive walls create participatory experiences within queues. Guests can interact with characters, trigger environmental effects, or compete with other guests in adjacent queue sections.
These installations use depth cameras (Intel RealSense, Azure Kinect, LiDAR sensors) to track guest movement without requiring physical contact---critical for throughput. A well-designed interactive wall can entertain 20--40 guests simultaneously without creating bottlenecks.
The key design constraint is dwell time management: the interaction must be engaging enough to reduce perceived wait, but not so engaging that guests stop moving forward. The best implementations use a "walk-and-play" model where content travels with the guest along the queue path.
2-3. AR and mobile queue experiences
App-based augmented reality layers digital content onto the physical queue environment. Guests point their phones at themed markers, surfaces, or empty spaces to reveal hidden characters, solve puzzles, or unlock ride-specific content.
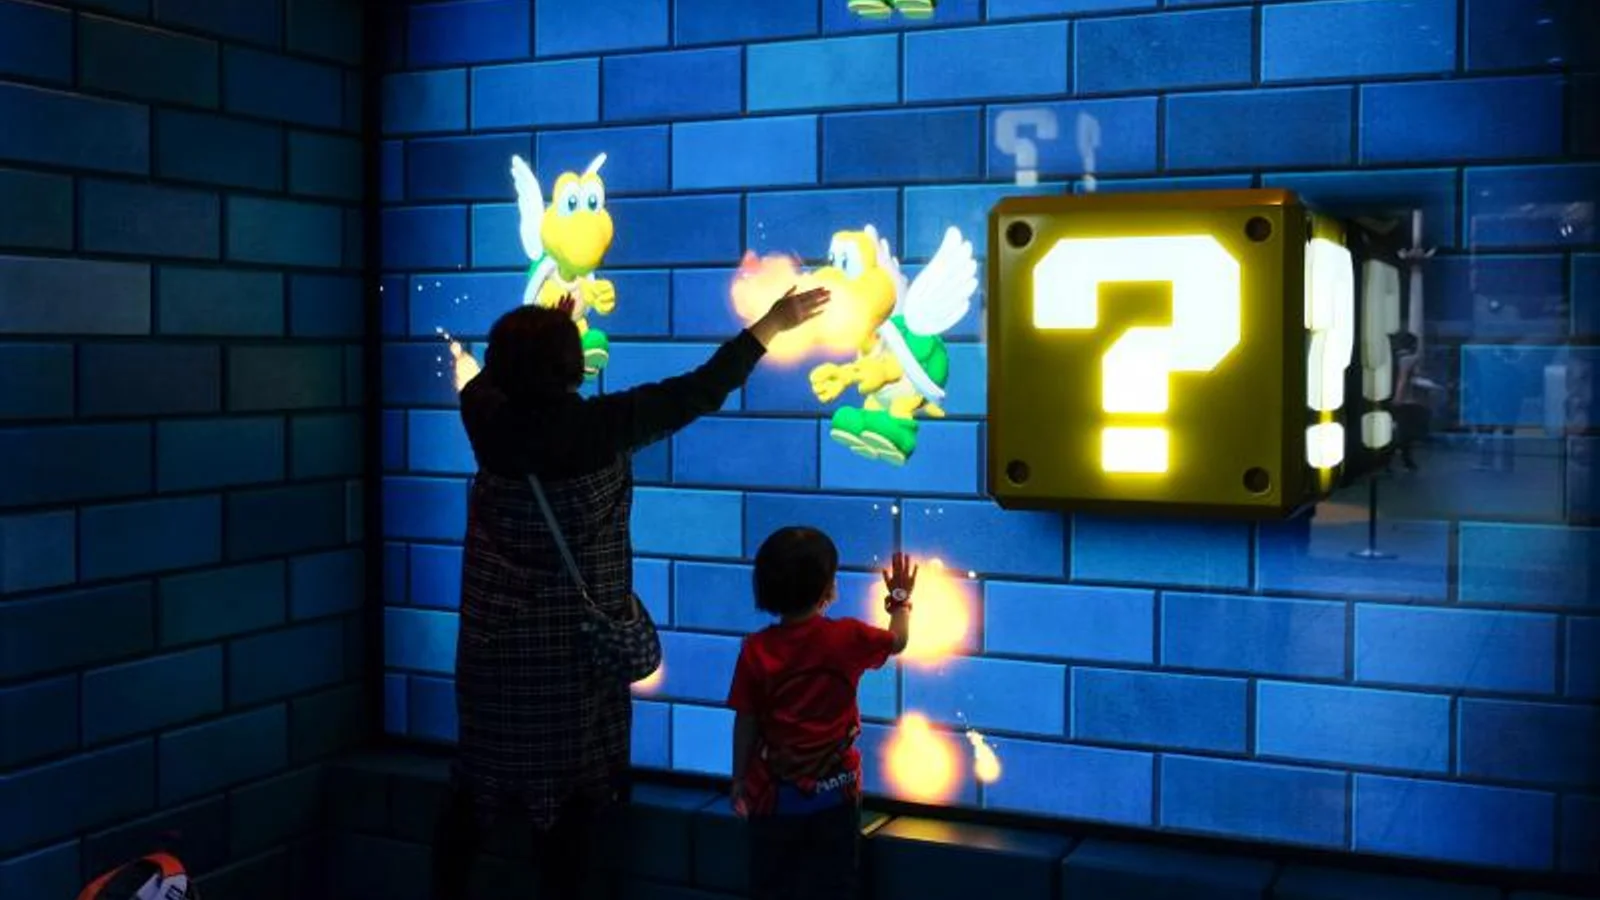
Universal's Super Nintendo World pioneered this at scale with the Power-Up Band: a wearable RFID device that lets guests collect coins, hit blocks, and compete in mini-games throughout the land---including while waiting in queue. This transforms the entire land into a persistent interactive game, with the queue as one zone of many.
The tradeoff: app-based experiences require guests to have a charged phone and a downloaded app (or wearable device), which limits participation rates to roughly 40--60% of queue guests. Non-app guests must still have a satisfying experience.
2-4. Gamified waiting systems
Gamification adds scoring, competition, and progression to the queue experience:
- Real-time leaderboards that track guest performance across queue mini-games
- Queue position integration where your position in line unlocks new narrative content
- Competitive elements between queue sections or groups
- Collectible rewards (digital badges, in-app achievements) tied to queue engagement
The most sophisticated systems connect queue performance to the ride itself. At Buzz Lightyear's Space Ranger Spin (Disney), guests build anticipation by competing for high scores---a model that next-generation attractions are extending with personalized ride-scene triggers based on pre-ride queue choices.
3. Dark Ride Interactive Technologies
Dark rides---enclosed attractions where guests travel through themed scenes in vehicles---are the canvas where interactive technology has the highest impact. The shift from passive viewing to active participation has redefined what a ride experience can be.
3-1. Trackless ride systems
Trackless vehicles (from manufacturers like ETF Ride Systems, Oceaneering, and Intamin) use LGV (laser-guided vehicle) or wire-guided technology to move independently through a show building. This enables:
- Non-linear storytelling: each vehicle can take a different path through the same scenes, so guests get a different experience on each ride
- Dynamic choreography: vehicles can spin, reverse, pause, and synchronize with show elements
- Scalable capacity: vehicles operate independently, so throughput isn't limited by a fixed track layout
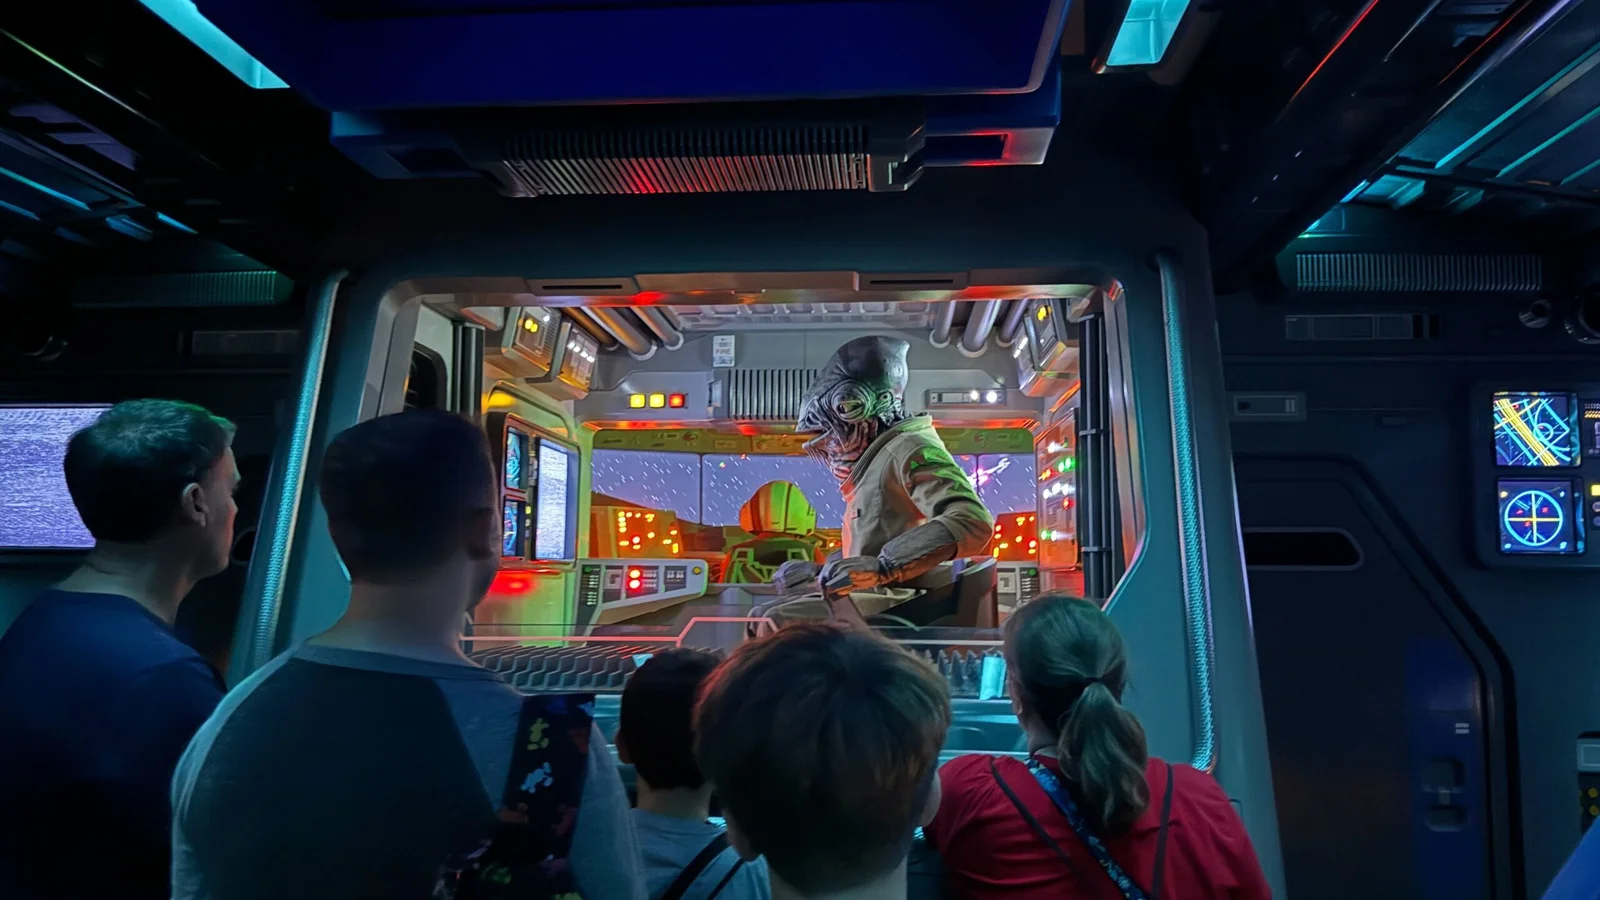
Disney's Rise of the Resistance uses 18 trackless vehicles simultaneously, each carrying 8 guests through a multi-scene narrative that includes a full-size AT-AT walker, laser battles, and a simulated escape sequence. The ride achieves approximately 1,700 riders per hour---competitive with traditional tracked rides despite the non-linear path.
3-2. Mixed reality on vehicles
AR/MR headsets mounted on ride vehicles blend physical scenery with real-time digital content. The guest sees the physical set through the visor, with digital characters, effects, and interactive elements layered on top.
Mario Kart: Koopa's Challenge at USJ Osaka is the benchmark. Guests wear AR visors (developed with Nintendo) that project characters, items, and race-track elements onto physical sets. The system tracks head position and links to in-ride scoring---guests compete in a kart race where physical and digital elements are seamlessly integrated.
Challenges at scale:
- Headset hygiene and turnaround: each visor must be sanitized between guests, adding 5--10 seconds to load/unload cycles
- Motion sickness: AR content must be precisely synchronized with vehicle movement to prevent nausea
- Hardware durability: visors endure thousands of uses daily in varying temperatures and humidity
- Throughput impact: headset distribution and collection adds 15--30 seconds per vehicle cycle
3-3. Interactive shooting and gesture systems
The evolution from simple point-and-shoot (Buzz Lightyear, Men in Black) to sophisticated gesture-tracking systems:
- Next-gen scoring: real-time hit detection with particle effects, environmental damage, and chain reactions visible to all riders
- Gesture recognition: riders use hand movements instead of physical blasters (reducing maintenance and enabling more fluid interaction)
- Cooperative/competitive modes: riders in the same vehicle can work together or compete, with scores displayed on post-ride screens and apps
Alterface and Sally Corporation specialize in interactive dark ride systems with turnkey scoring, targeting, and media integration packages. Budget: $2--8M for a complete interactive dark ride (excluding building construction).
3-4. Real-time personalization
RFID wearables and facial recognition systems enable ride scenes that respond to individual guests:
- Name recognition: characters greet riders by name (via MagicBand or equivalent)
- Preference-based content: ride scenes shift based on guest history, language, or loyalty tier
- Photo integration: ride photos are automatically captured, tagged, and delivered to the guest's app
Tokyo Disneyland's Enchanted Tale of Beauty and the Beast personalizes the experience through RFID-linked reservation data, adjusting pre-show language and interaction patterns for each ride vehicle. The system handles 1,500+ riders per hour while maintaining personalization.
3-5. Animatronic-digital hybrid
The most compelling dark ride scenes combine physical figures with digital enhancement:
- Projection-mapped faces: projecting animated expressions onto sculpted heads (used extensively in Disney's Frozen Ever After and Pirates of the Caribbean: Battle for the Sunken Treasure in Shanghai)
- LED scenic panels: replacing painted backdrops with dynamic LED environments that change per ride cycle
- Holographic characters: pepper's ghost and transparent OLED displays that create floating figures in physical space
Shanghai Disneyland's Pirates of the Caribbean: Battle for the Sunken Treasure is the gold standard: a boat ride through massive projection-mapped environments with physical water effects, animatronic figures, and an underwater battle sequence that blurs the line between physical and digital scenery.
4. Digital Overlay for Existing Attractions
Not every park can afford a ground-up attraction. Digital overlay upgrades existing rides and spaces with technology layers that deliver a fresh experience on existing infrastructure.
4-1. Projection augmentation of physical sets
Adding projection layers to existing practical scenery enhances scenes without replacing them:
- Animated textures on static surfaces (waterfalls, fire, weather effects)
- Character appearances on previously empty walls or set pieces
- Seasonal transformations (Halloween, holiday overlays) without physical scenic changes
This approach works best on dark rides with controlled lighting. Disney's Haunted Mansion has been progressively enhanced with projection effects (notably the ballroom scene and Hatbox Ghost) that coexist with decades-old physical scenery.
4-2. LED scenic replacement
Swapping painted backdrops for LED volume walls enables fundamentally different experiences on the same ride system:
- Scene-by-scene content updates without physical construction
- Seasonal or event-based transformations via content management
- Unlimited depth and parallax through virtual scenography
The ride vehicle, track, and building remain unchanged. Only the visual environment shifts. This model extends the commercial life of a ride by 5--10 years at a fraction of demolition-and-rebuild cost.
4-3. Mobile app augmentation
App-based AR layers transform what guests see in any physical space:
- Point a phone at a themed facade to see hidden characters or story elements
- Scavenger hunts that span the entire park, turning walkways into interactive zones
- Post-ride content that extends the story beyond the ride exit
Disney's Play Disney Parks app pioneered this model, offering location-based trivia, achievements, and interactive experiences tied to specific attractions and lands. The cost is primarily software development (no physical hardware installation), making it the lowest-cost overlay option.
4-4. The economics of refresh vs. rebuild
| Approach | Typical Cost | Timeline | Asset Life Extension |
|---|---|---|---|
| Digital projection overlay | $500K--$2M | 3--6 months | 3--5 years |
| LED scenic replacement | $2--5M | 6--12 months | 5--10 years |
| Interactive system retrofit | $1--5M | 6--18 months | 5--8 years |
| Ground-up new attraction | $200--500M+ | 4--7 years | 15--25 years |
The math is straightforward: if a digital refresh costs 1--5% of a new-build and extends commercial viability by 5--10 years, the ROI calculation strongly favors overlay---especially for mid-tier parks that can't access $200M+ capital budgets.
5. Real-World Case Studies
5-1. Super Nintendo World — USJ Osaka
Investment: Estimated ¥60 billion+ ($400M+) | Opened: 2021 (Phase 1), 2024 (Donkey Kong Country)
USJ Osaka's Super Nintendo World is the most integrated interactive land ever built. Every element---from the queue to the ride to the walkthrough environment---is connected through the Power-Up Band wearable:
- Mario Kart: Koopa's Challenge: AR visor ride with real-time scoring, physical + digital environments, gesture interaction
- Queue gamification: guests collect coins, hit interactive blocks, and compete in mini-games throughout the queue
- Land-wide integration: achievements persist across the entire land, connecting rides, restaurants, and walkthrough experiences into a single interactive ecosystem
The result: Super Nintendo World drove USJ attendance to a record 16 million+ visitors in its opening year, with guests spending an average of 3+ hours in the land alone.
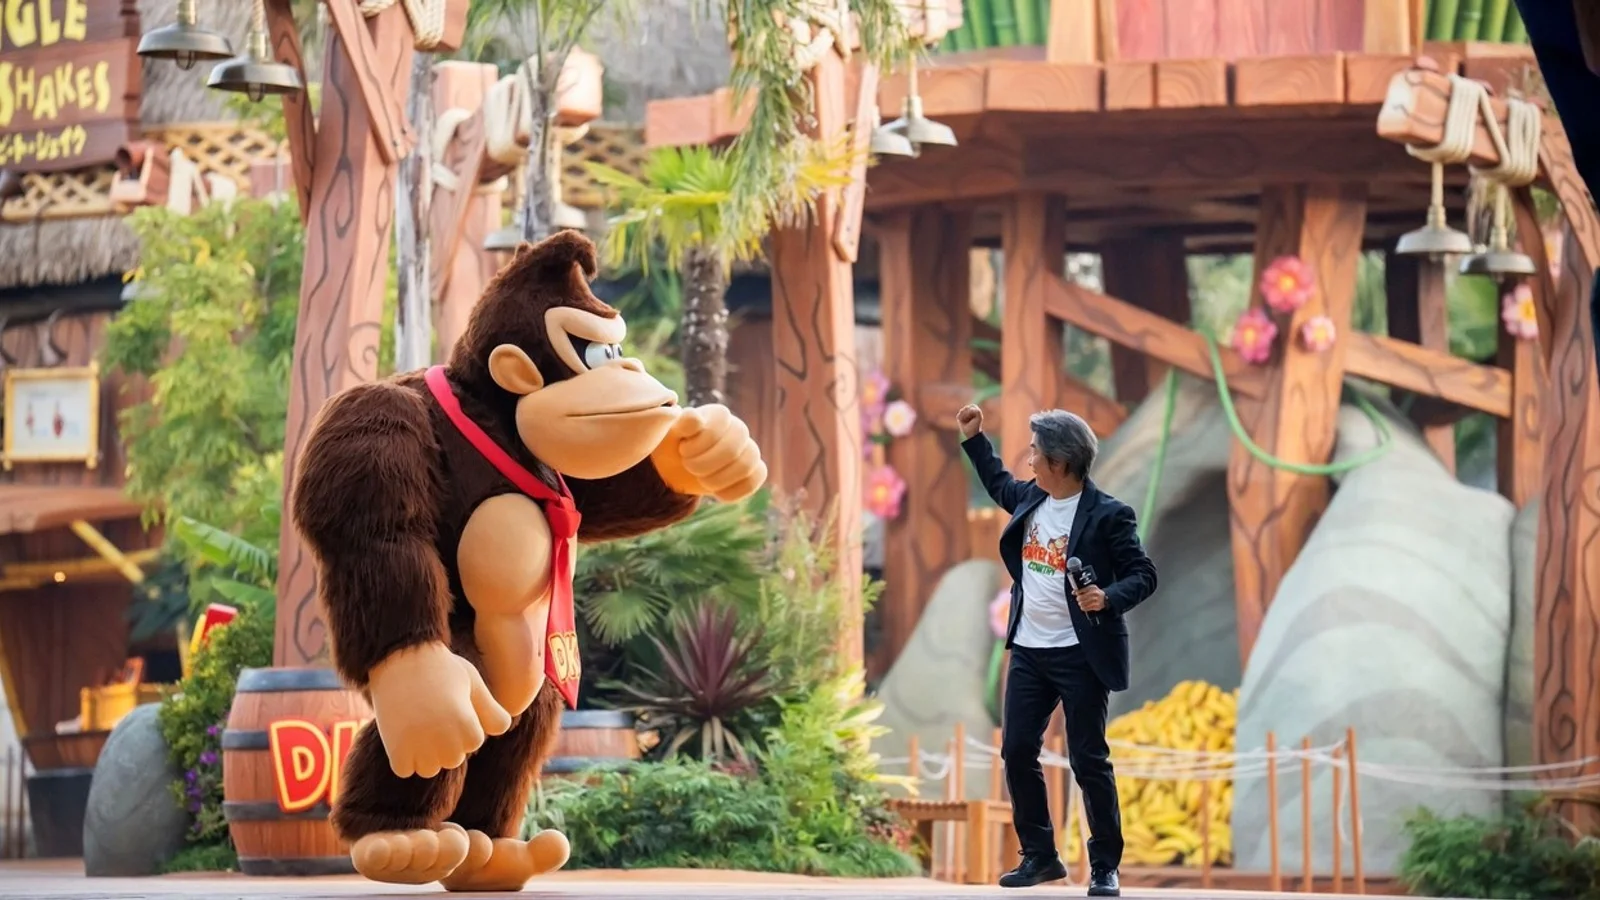
The 2024 Donkey Kong Country expansion extends the Power-Up Band ecosystem with body-interactive elements and a Mine Cart Madness coaster integrated with the land-wide scoring system.
5-2. Rise of the Resistance — Disney Hollywood Studios
Investment: Estimated $250M+ | Opened: 2019
Disney's most ambitious dark ride combines every technology in this guide:
- Pre-show queue: 15-minute narrative experience with life-size holographic characters (Rey, Kylo Ren), practical sets, and storyline integration
- Trackless vehicles: 18 vehicles operating simultaneously with non-linear paths
- Practical + digital scenes: full-size AT-AT walkers, laser effects, projection-mapped environments
- Drop sequence: vehicles enter a simulated Star Destroyer with a trackless drop section
Throughput: approximately 1,700 riders per hour. Satisfaction scores consistently rank it as the highest-rated attraction at Walt Disney World.
5-3. Hagrid's Magical Creatures Motorbike Adventure — Universal Orlando
Investment: Estimated $300M+ | Opened: 2019
The queue experience is as celebrated as the ride:
- Walk-through Hagrid's hut with animatronic and projection effects
- Encounter magical creatures in illuminated terrariums
- Story-driven queue progression where each room advances the narrative
The ride itself combines a launched roller coaster with dark ride show scenes---trackless vehicles wouldn't work for the coaster elements, but the integration of physical sets with projection and animatronic effects creates a hybrid that blurs the line between ride types.
5-4. Fantasy Springs — Tokyo DisneySea
Investment: ¥320 billion ($2.1B+) | Opened: 2024
Oriental Land Company's largest single expansion includes three new attractions and a themed hotel:
- Peter Pan's Neverland Adventure: trackless dark ride with projection-mapped environments
- Rapunzel's Lantern Festival: boat ride with LED and projection scenic
- Frozen Kingdom: walk-through area with seasonal interactive elements
Fantasy Springs demonstrates the current ceiling for theme park investment in Japan. The technology integration prioritizes seamless storytelling over visible interactivity---the omotenashi philosophy of "invisible technology" that enhances without intruding.
5-5. Shanghai Disneyland — Pirates of the Caribbean: Battle for the Sunken Treasure
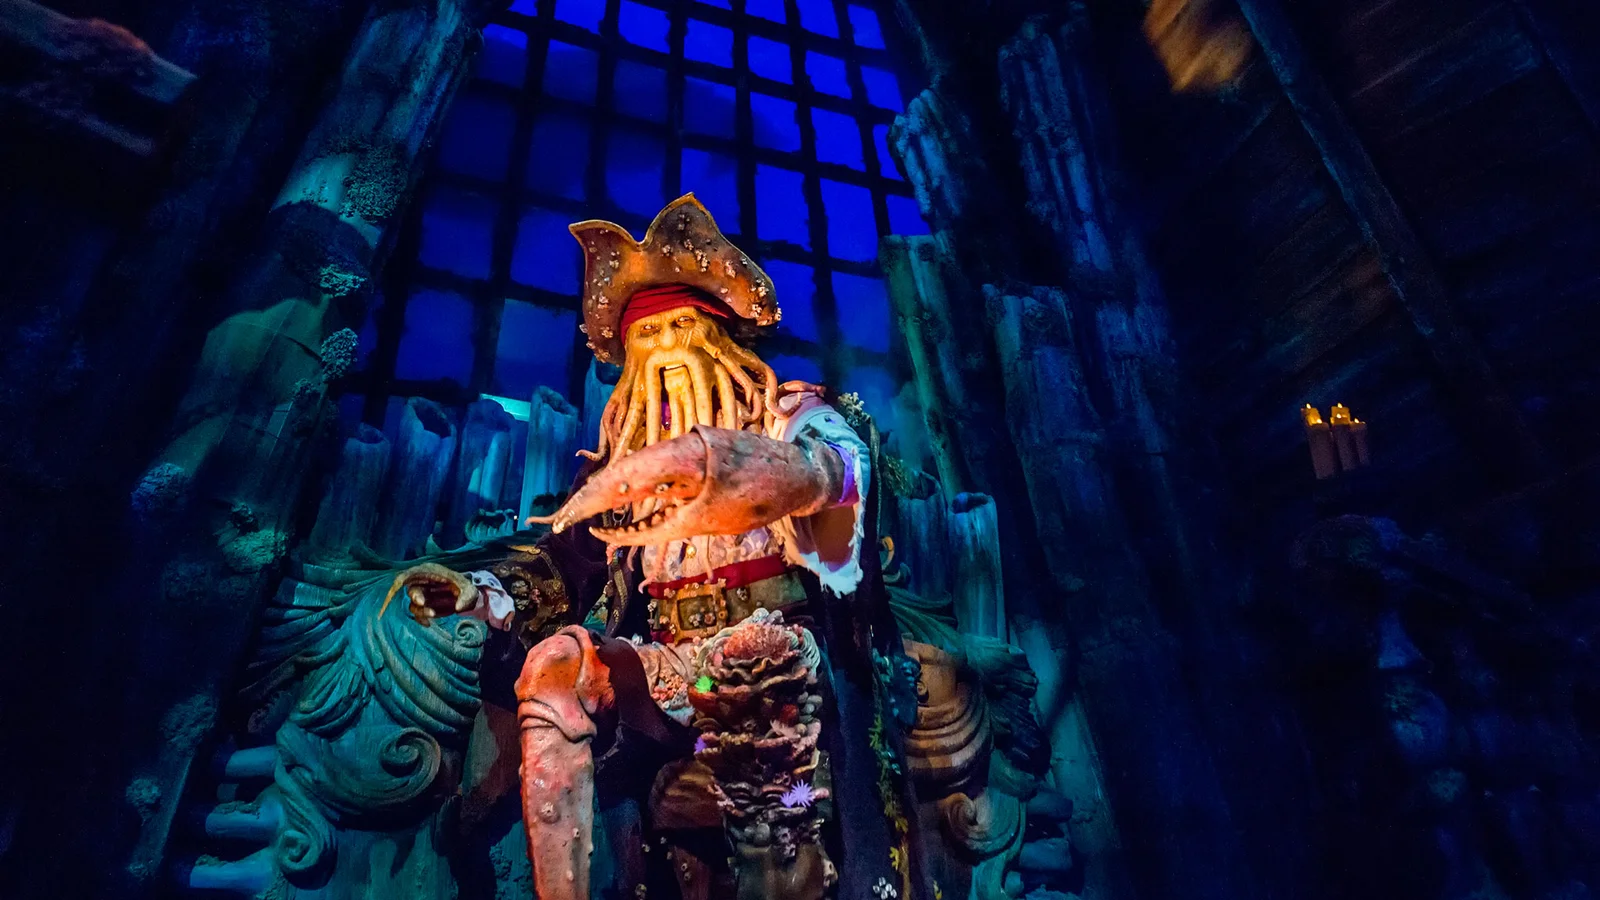
Opened: 2016 (remains the technology benchmark into 2026)
The gold standard for animatronic-digital hybrid dark rides. Trackless boats spin, reverse, and move laterally through massive projection-mapped underwater environments, synchronized with physical water effects, fire, and next-generation animatronic figures. The Jack Sparrow figure uses projection-mapped facial animation on a sculpted head---a technique now widely adopted across Disney parks.
5-6. Epic Universe — Universal Orlando
Announced investment: $6.95 billion | Opening: 2025
Universal's third Orlando gate represents the next generation of interactive park design:
- Five themed worlds, each with integrated interactive systems
- Super Nintendo World expansion with next-gen interactives
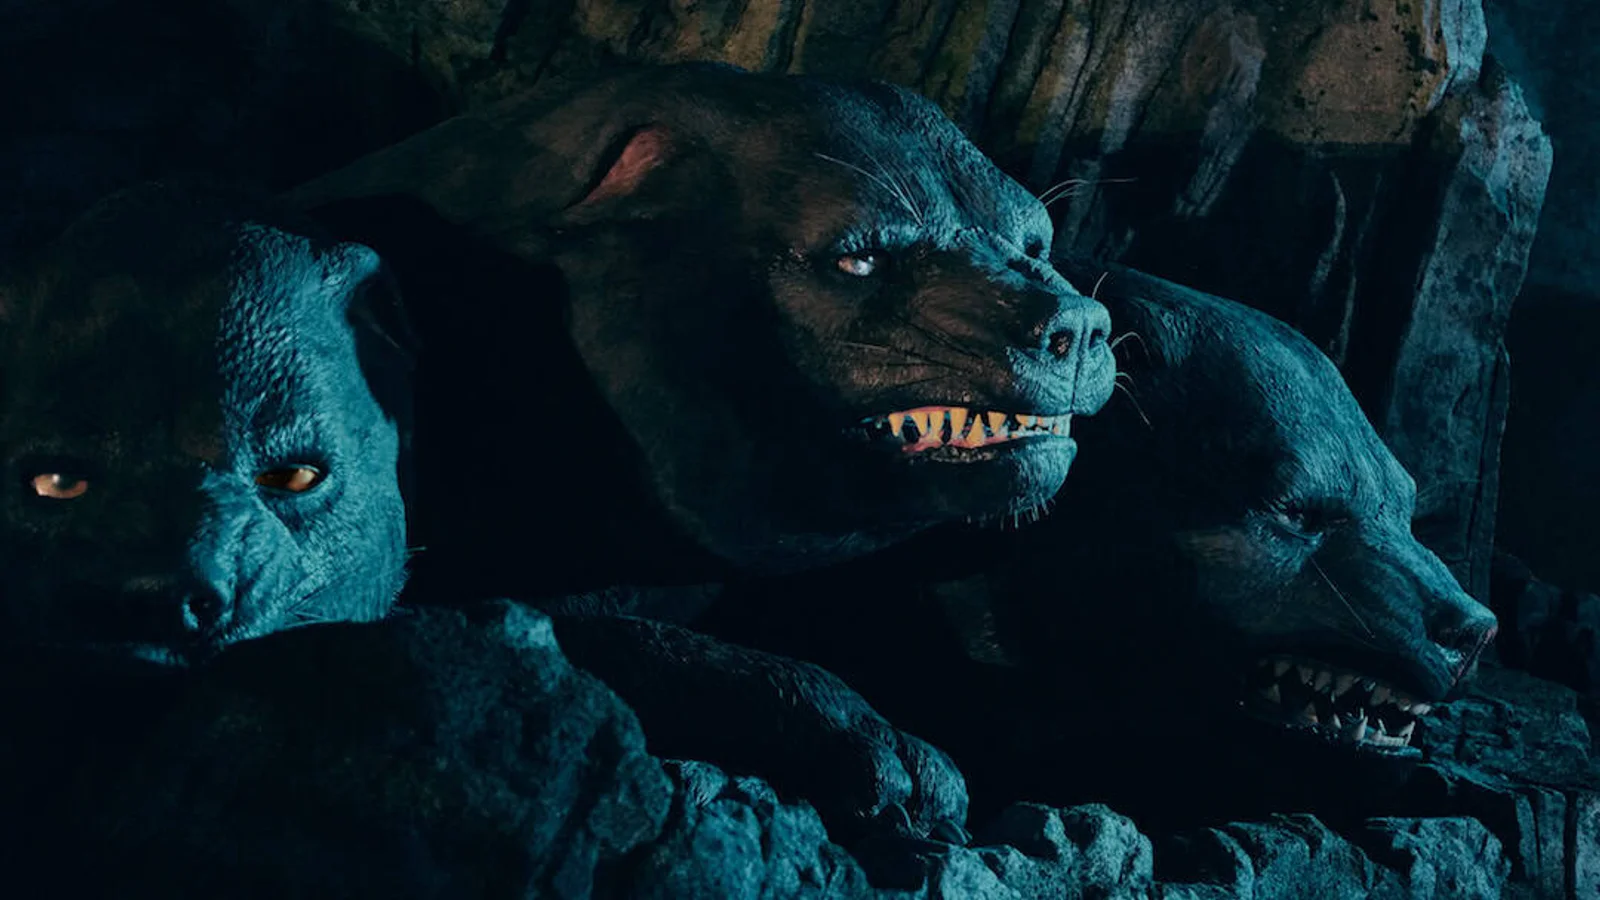
- Dark Universe: horror-themed land with real-time environmental effects
- Technology investment reportedly exceeds any previous Universal project
Epic Universe will set new benchmarks for interactive integration at the park-wide level, with wearable technology connecting experiences across all five worlds.
5-7. VelociCoaster — Universal Orlando
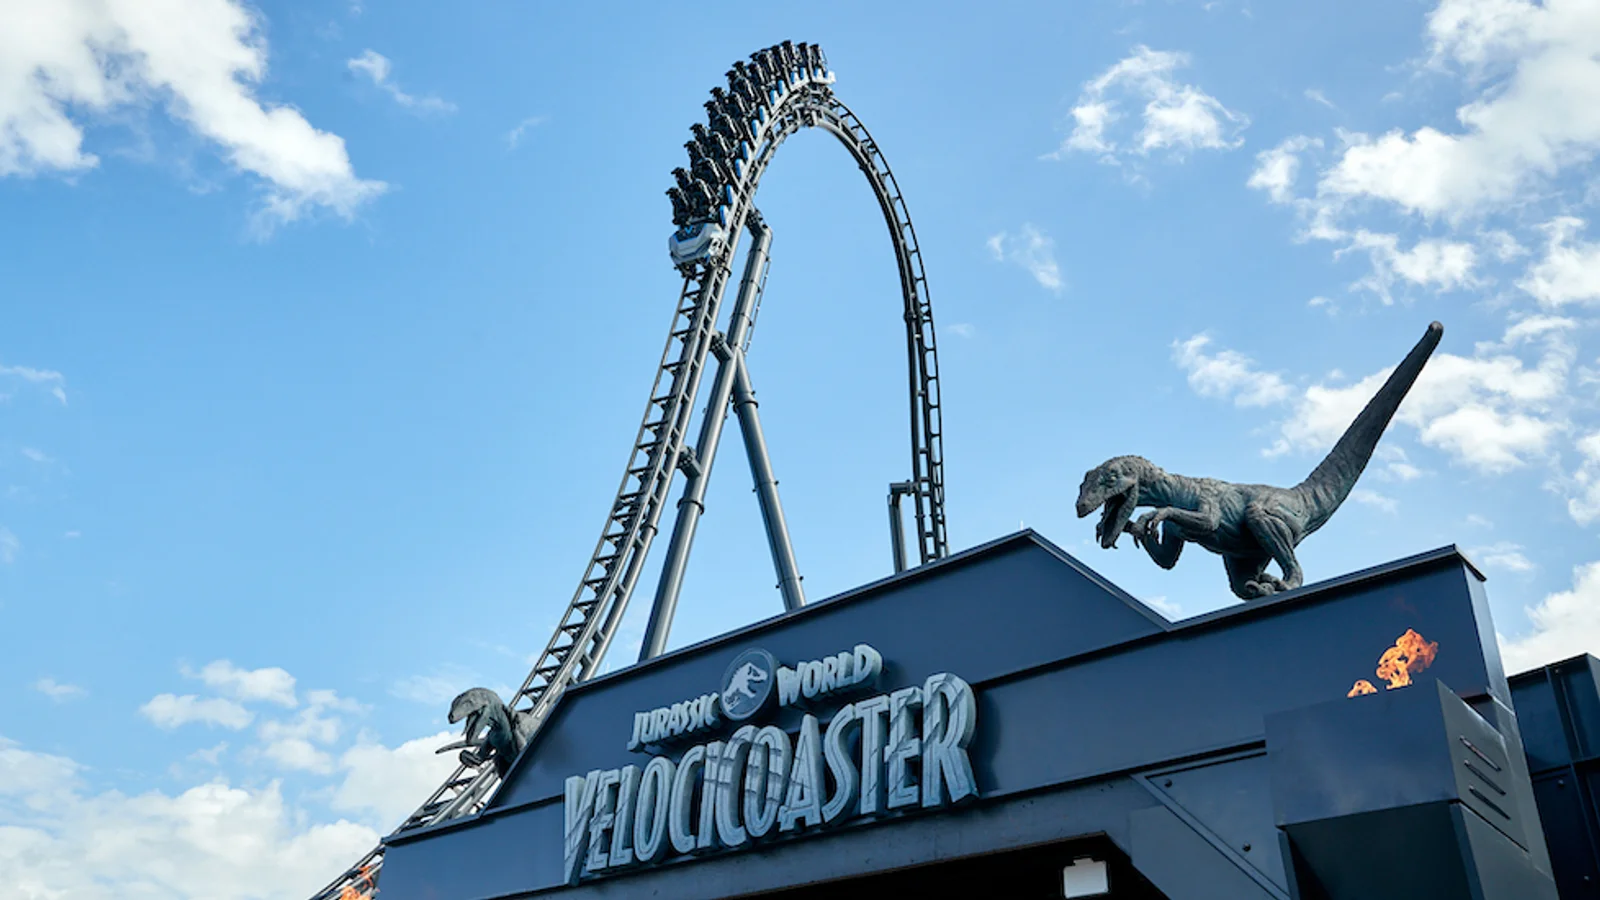
Opened: 2021
An example of how high-quality queue theming elevates even a pure roller coaster. The queue features raptor paddock animatronics, high-definition OLED video screens (an early adoption for themed queues), and pre-show videos that build the Jurassic narrative. The investment in queue experience directly supports guest tolerance for 60--90 minute waits.
5-8. teamLab Borderless — Tokyo
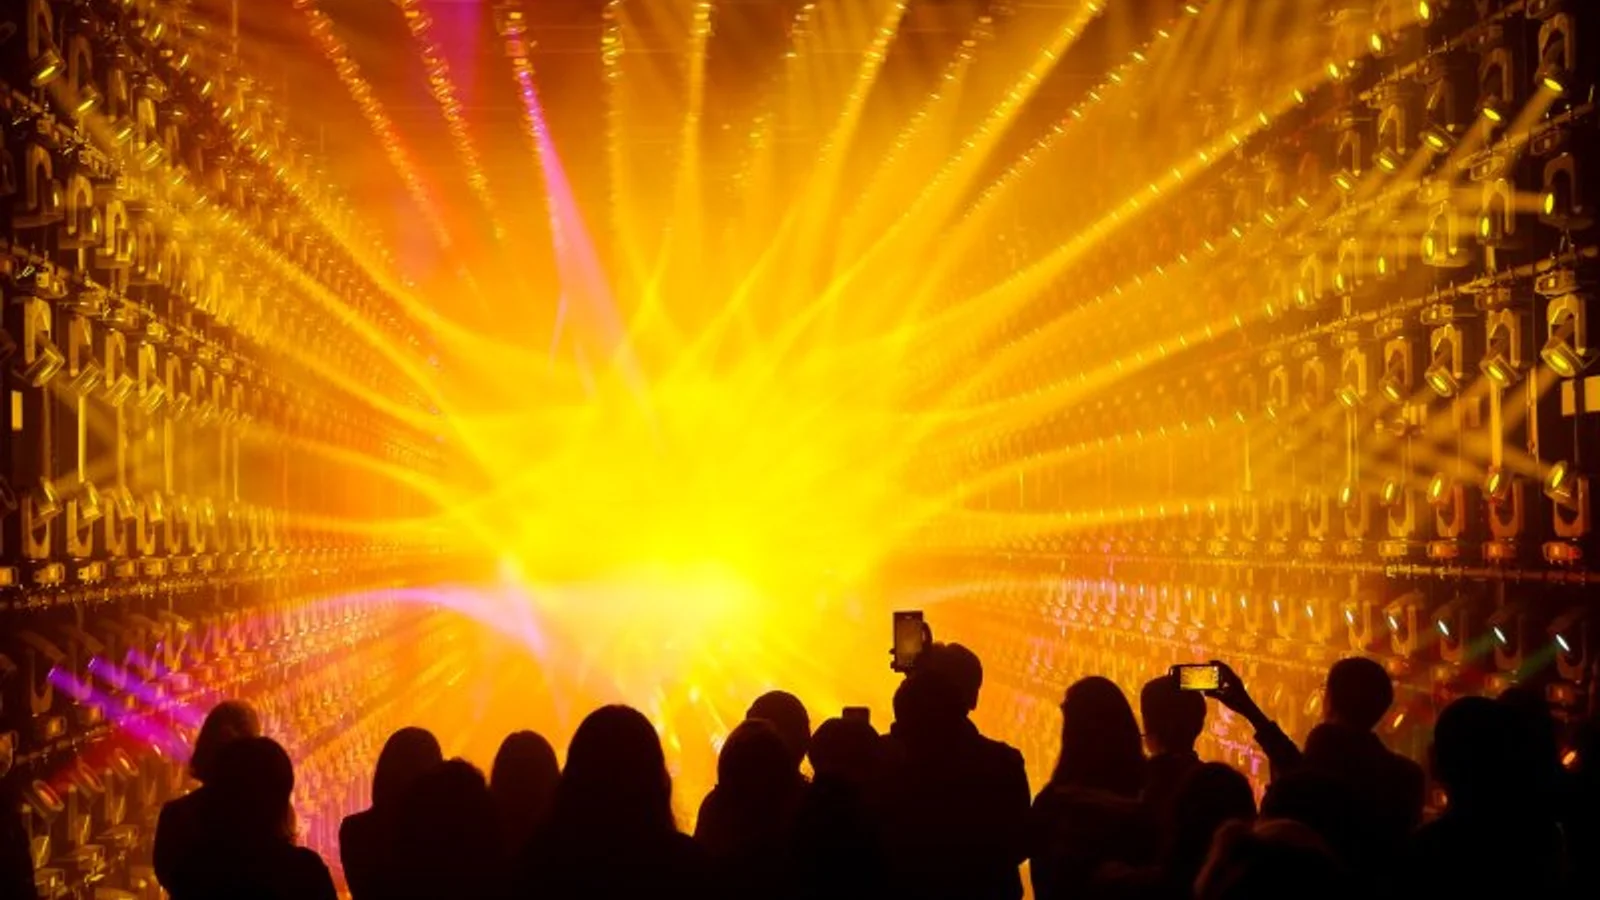
While not a traditional theme park, teamLab Borderless at Azabudai Hills (4.2 million annual visitors, 65% international) proves that body-tracking and real-time generative art can sustain theme-park-level attendance. The technology---sensor-driven projections, crowd-reactive algorithms, seamless room transitions---is directly transferable to queue entertainment and fan zone installations.
6. Budget Breakdown by Scale
| Tier | Budget Range | Scope | Timeline |
|---|---|---|---|
| Queue overlay | $500K--$1M | Single attraction queue with projection mapping, interactive walls, or gamified elements | 3--6 months |
| Multi-zone queue + pre-show | $1--3M | Multiple queue sections with narrative progression, pre-show experience, and show control | 6--12 months |
| Dark ride tech package | $3--10M | Full interactive system for existing or new dark ride: tracking, scoring, projection, show control | 12--24 months |
| Ground-up interactive attraction | $10M+ | New attraction with integrated trackless vehicles, MR, and land-wide interactive systems | 24--36+ months |
Cost structure breakdown
A typical mid-scale installation ($1--5M) breaks down approximately:
- Hardware (40%): projectors, LED panels, sensors, media servers, show control systems, networking
- Content production (30%): 3D animation, interactive software, real-time rendering, audio design
- Integration and installation (20%): physical mounting, electrical, data infrastructure, commissioning
- Project management and design (10%): creative development, technical design, documentation
Ongoing costs
- Hardware maintenance: 10--15% of hardware cost annually (preventive maintenance, component replacement)
- Content refresh: 15--25% of initial content cost annually (seasonal updates, event content, bug fixes)
- Operations: 0.5--1.0 FTE for monitoring and support per major installation zone
- Show control licensing: $5K--$50K annually depending on system complexity
For a detailed framework on installation budgeting across venue types, see our interactive installation cost guide.
7. Technology Partners and Vendor Landscape
Show control and media servers
| Company | Specialty | Notable Projects |
|---|---|---|
| 7thSense (formerly Medialon) | Show control + high-resolution media servers | Universal Studios, Disney, Merlin |
| Alcorn McBride | Audio/video show control | Disney Imagineering, SeaWorld |
| disguise | Projection mapping, virtual production | The Sphere, immersive theater |
Ride systems
| Company | Specialty |
|---|---|
| ETF Ride Systems | Trackless vehicles, flying theaters |
| Oceaneering | Trackless AGVs for dark rides |
| Intamin | Coasters, dark rides, trackless |
Interactive and immersive design
| Company | Specialty |
|---|---|
| Alterface | Interactive dark ride systems, media-based attractions |
| Holovis | XR rides, interactive media attractions |
| Simworx | Motion simulation, 4D/5D theaters |
| Moment Factory | Immersive environments, projection mapping |
| Utsubo | Web-based interactive installations, real-time 3D (Three.js/WebGL), body-tracking experiences, interactive projection mapping |
Japan-based partners
- teamLab: immersive digital art, body-tracking installations
- Panasonic Connect: professional projection systems
- Sony: spatial reality displays, sensor technology
- Rhizomatiks: interactive technology, real-time motion tracking
For a deeper look at Japan-based studios, see our interactive installation studios in Japan guide.
8. Common Pitfalls
8-1. Throughput destruction
The most common failure mode: interactive elements that slow ride loading and unloading. Every second added to the load/unload cycle compounds across thousands of daily riders.
Rule of thumb: if an interactive element adds more than 10 seconds to the vehicle cycle, it reduces hourly capacity by 5--10%. Design interactions that happen in motion, not at rest.
8-2. Environmental durability
Theme park hardware operates 14--18 hours daily, 365 days a year, in environments that include:
- Outdoor queues with UV exposure, rain, and temperature swings
- Indoor spaces with high humidity from water effects and crowd density
- Vibration from ride systems
Consumer-grade technology fails within months. Specify commercial/industrial-grade hardware: IP65/IP67-rated enclosures, operating temperature ranges of -20°C to 50°C, and vibration-rated mounts. Budget 20--40% more for outdoor installations than equivalent indoor deployments.
8-3. Content staleness
Opening-day content generates excitement. Twelve months later, repeat visitors have seen it all. Without a content refresh strategy, interactive installations become expensive wallpaper.
Plan before you build: map the first 18 months of content updates---seasonal overlays, event tie-ins, character rotations, competitive leaderboard resets. Budget the refresh cycle into the original business case.
8-4. Maintenance at park scale
A museum installation runs 8--10 hours daily. A theme park installation runs 14--18 hours, with 30-minute turnarounds for daily maintenance. The maintenance burden is 2--3x what most studios quote for non-park venues.
Require remote monitoring and predictive maintenance in vendor contracts. A failed projector at 9 AM that can't be replaced until the next morning means a full day of degraded guest experience.
8-5. Accessibility
Interactive queue elements must be accessible to guests using wheelchairs, guests with visual or hearing impairments, and guests with cognitive differences. This isn't optional---it's required by ADA (in the US), the Equality Act (UK), and equivalent regulations globally. In Japan, バリアフリー法 (Barrier-Free Act) applies to all public attraction facilities.
Design for universal interaction: body-tracking systems that work from seated height, audio descriptions for visual content, haptic feedback alternatives, and clear visual wayfinding for guests with hearing impairments.
9. How to Get Started---A Roadmap
Phase 1: Audit and opportunity mapping (1--2 months) Walk every queue, pre-show, and transition space in your park. Document: current guest flow, dwell time by zone, infrastructure readiness (power, data, structural load capacity), and the narrative potential of each space.
Phase 2: Define experience goals tied to business metrics (1--2 months) "We want something interactive" isn't a brief. Define measurable outcomes: perceived wait time reduction, guest satisfaction uplift, per-cap spending increase, social media mention targets. Tie each installation to a specific business metric. See our studio briefing guide for how to write an effective brief.
Phase 3: Concept development and technology feasibility (3--6 months) Develop 2--3 concepts per priority zone. Test technology assumptions with vendor prototypes. Assess throughput impact through simulation. Review sound design implications for enclosed queue spaces.
Phase 4: Design development and prototyping (6--12 months) Full technical design, content production, hardware specification, and show control programming. Build and test a full-scale prototype of the most complex interactive element before committing to fabrication.
Phase 5: Fabrication, integration, and commissioning (6--18 months) Hardware installation during off-peak periods or scheduled closures. System integration, content loading, and show programming. Soft-launch testing with controlled guest groups before public opening.
Total timeline: 12--36 months depending on scope, from initial audit to public opening.
10. About Utsubo
Utsubo is a creative studio specializing in interactive installations and immersive digital experiences. We combine Three.js expertise with physical installation design to create memorable experiences that respond to guest presence and movement.
What we offer:
- Custom interactive installations for theme parks, entertainment venues, museums, hotels, and retail
- Real-time 3D content development using Three.js, WebGL, and WebGPU
- End-to-end design and implementation, from concept through ongoing support
- Japan-based team with proximity to USJ Osaka, Tokyo Disney Resort, and the 2025 Expo
11. Let's Talk
Building an interactive experience for a theme park or attraction? We work with park operators and design firms on queue entertainment, interactive ride elements, and guest engagement technology.
If you're exploring a partnership, let's discuss your project:
- What you're building and the throughput constraints you're working with
- Which technology approach makes sense for your guest experience goals
- Whether we're the right fit to help you execute
Theme Park Interactive Installation Checklist
- Audited all queues, pre-shows, and transition spaces for interactive potential
- Defined measurable goals tied to business metrics (perceived wait reduction, satisfaction, per-cap spend)
- Assessed throughput impact of proposed interactive elements (10-second rule)
- Evaluated technology options: projection mapping vs. LED vs. AR vs. body tracking for each zone
- Confirmed infrastructure readiness: power, data, structural load, HVAC for electronics
- Specified commercial/industrial-grade hardware rated for 14--18 hour daily operation
- Planned content refresh cycle: seasonal overlays, event tie-ins, leaderboard resets
- Budgeted for ongoing maintenance (10--15% hardware, 15--25% content annually)
- Reviewed accessibility requirements: ADA, Equality Act, or バリアフリー法 compliance
- Integrated with existing park systems: ticketing, wearables, mobile app, CRM
- Established remote monitoring and predictive maintenance protocols
- Planned phased rollout: pilot zone before full-scale deployment
- Defined a post-launch measurement framework with baseline data captured before installation
FAQs
How much does it cost to add interactive elements to a theme park queue?
Budget $500K--$1M for a single-zone queue overlay with projection mapping or interactive walls. Multi-zone queue entertainment with narrative progression and pre-show integration runs $1--3M. These ranges assume commercial-grade hardware rated for theme park operating conditions (14--18 hours daily, 365 days per year). Consumer-grade alternatives cost less upfront but fail within months at park scale.
How long does it take to implement queue entertainment?
From concept approval to public opening, expect 6--12 months for a single-zone queue overlay and 12--24 months for multi-zone or pre-show integration. The timeline is driven less by technology installation and more by content development, show programming, and the park's operational windows for construction access.
Will interactive queue elements slow down ride throughput?
They can, if poorly designed. The critical rule: interactive elements should engage guests while they're moving through the queue, not while they're loading onto the ride. Elements that cause guests to stop and cluster create bottlenecks. Design for "walk-and-play" interaction, and test throughput impact during prototyping before committing to installation.
What's the difference between AR overlay and projection mapping for attractions?
Projection mapping creates a shared visual experience visible to all guests simultaneously---no device or headset required. AR overlay (via visor or mobile device) adds personal digital content visible only to the individual user. Projection is better for queue environments where universal experience matters. AR is better for ride vehicles where personalization adds value. The two complement each other and are increasingly used together.
Can interactive technology work in outdoor queue environments?
Yes, but with significantly higher hardware costs. Outdoor installations require IP65/IP67-rated enclosures, high-brightness displays or projectors (5,000+ lumens for daytime visibility), UV-resistant housings, and weatherproof cabling. Budget 20--40% more than equivalent indoor installations. Shade structures and controlled lighting can reduce brightness requirements and extend equipment life.
How often should interactive content be refreshed?
Plan for quarterly seasonal updates at minimum, with event-specific overlays as needed. Annual content refresh budgets should be 15--25% of the initial content investment. The most engaging park installations refresh competitive elements (leaderboards, challenges, collectibles) monthly and major narrative content quarterly. Parks that don't refresh see measurable drops in guest interaction rates within 6--12 months of opening.
Can you retrofit interactive technology onto an existing dark ride?
Yes. The most common retrofits include adding projection mapping to existing scenic surfaces, installing LED panels to replace painted backdrops, and layering AR content via mobile app or wearable device. The ride vehicle, track, and building structure remain unchanged. Cost: $1--5M depending on the number of scenes and the technology approach. Timeline: 6--18 months, with installation typically during scheduled annual closures.
What ROI metrics should we track for theme park installations?
Track five categories: (1) perceived wait time reduction via guest surveys, (2) overall satisfaction score changes (NPS, OSAT), (3) per-capita spending changes in adjacent retail and F&B, (4) social media mentions and UGC volume, and (5) repeat visit intent. Capture baseline data before installation so you can measure the delta. The strongest ROI cases come from parks that can correlate queue experience improvements with measurable per-cap spending increases.
 Osaka Interactive Installation Studio